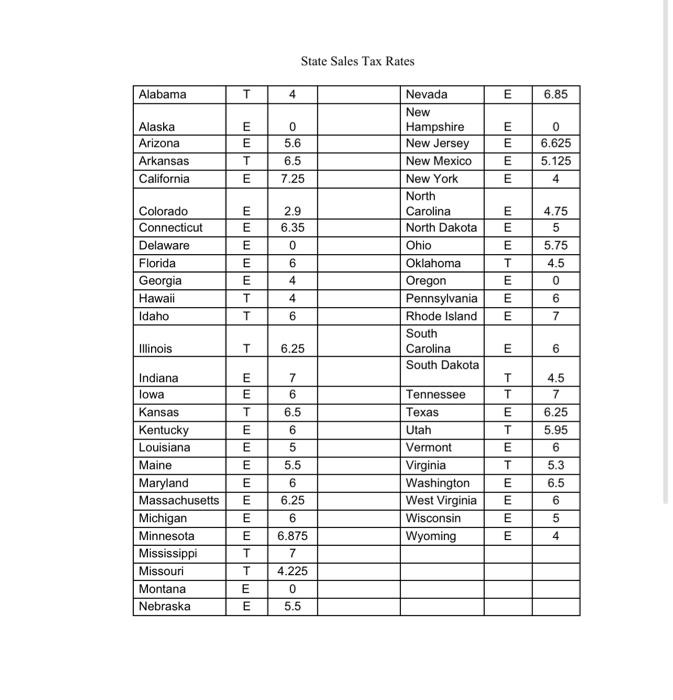
State Sales Tax Rates Alabama T 4 E 6.85 o Alaska Arizona Arkansas California mmm 0 5.6 6.5 7.25 E E E E 0 6.625 5.125 4 2.9 6.35 0 mmmm Colorado Connecticut Delaware Florida Georgia Hawaii Idaho Nevada New Hampshire New Jersey New Mexico New York North Carolina North Dakota Ohio Oklahoma Oregon Pennsylvania Rhode Island South Carolina South Dakota mmm E E E T E E 6 4 4.75 5 5.75 4.5 0 6 7 E T T 4 6 CON T E Illinois T 6.25 E 6 09 7 6 6.5 6 Indiana lowa Kansas Kentucky Louisiana Maine Maryland Massachusetts Michigan Minnesota Mississippi Missouri Montana Nebraska 5.5 ||=|||||E|| || T T E T E E E E E Tennessee Texas Utah Vermont Virginia Washington West Virginia Wisconsin Wyoming 4.5 7 6.25 5.95 6 5.3 6.5 6 5 4 III 6.25 6 6.875 7 4.225 lol 5.5 2. Attached is a table of state sales tax rates for the 50 states. The table also indicates whether or not groceries are taxable in the state (T-taxable (possibly at a lower rate), E-exempt from tax). Make a back-to-back stem and leaf plot of the data. On one side of the plot put the tax rates for those states where groceries are taxable and on the other side put the tax rates for those states where groceries are tax exempt. Round all sales tax percentages to the nearest tenth of a percent. State Sales Tax Rates Alabama T 4 E 6.85 o Alaska Arizona Arkansas California mmm 0 5.6 6.5 7.25 E E E E 0 6.625 5.125 4 2.9 6.35 0 mmmm Colorado Connecticut Delaware Florida Georgia Hawaii Idaho Nevada New Hampshire New Jersey New Mexico New York North Carolina North Dakota Ohio Oklahoma Oregon Pennsylvania Rhode Island South Carolina South Dakota mmm E E E T E E 6 4 4.75 5 5.75 4.5 0 6 7 E T T 4 6 CON T E Illinois T 6.25 E 6 09 7 6 6.5 6 Indiana lowa Kansas Kentucky Louisiana Maine Maryland Massachusetts Michigan Minnesota Mississippi Missouri Montana Nebraska 5.5 ||=|||||E|| || T T E T E E E E E Tennessee Texas Utah Vermont Virginia Washington West Virginia Wisconsin Wyoming 4.5 7 6.25 5.95 6 5.3 6.5 6 5 4 III 6.25 6 6.875 7 4.225 lol 5.5 2. Attached is a table of state sales tax rates for the 50 states. The table also indicates whether or not groceries are taxable in the state (T-taxable (possibly at a lower rate), E-exempt from tax). Make a back-to-back stem and leaf plot of the data. On one side of the plot put the tax rates for those states where groceries are taxable and on the other side put the tax rates for those states where groceries are tax exempt. Round all sales tax percentages to the nearest tenth of a percent


