State the relative purchasing power parity (RPPP). Perform a regression analysis with the data. Conduct hypothesis testing whether equals 1 for Turkish lira and Egyptian Pound. Interpret the results of hypothesis testing , and conclude whether the RPPP holds for the Turkish liraU.S. dollar and Egyptian poundU.S. dollar exchange rates. 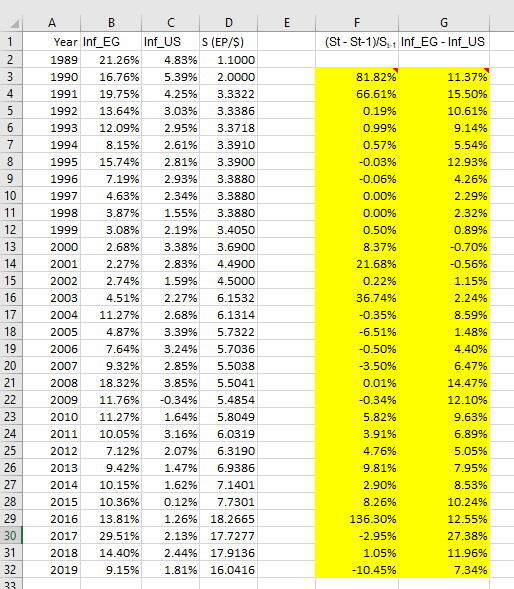
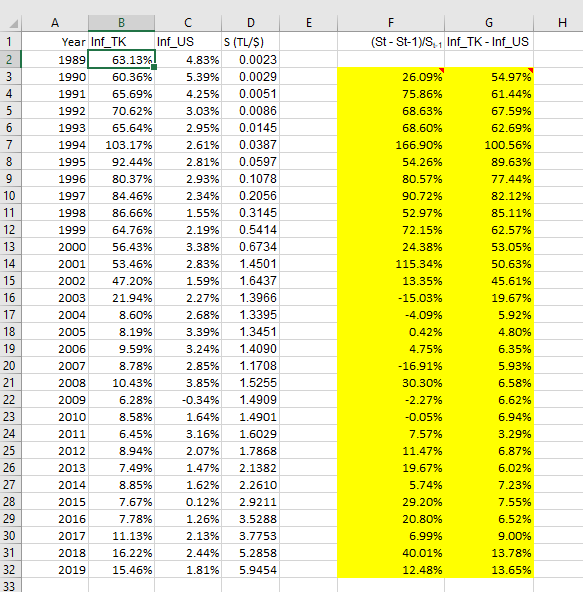
E F G (St-St-1)/S.1 Inf_EG - Inf_US 11.37% 15.50% 10.61% 9.14% 5.54% 12.93% 4.26% 2.29% 2.32% 1 2 3 4 5 6 7 8 9 10 11 12 13 14 15 16 17 18 19 20 21 22 23 24 25 26 27 28 29 30 31 32 33 A B C D Year Inf_EG Inf_US S (EP/S) 1989 21.26% 4.83% 1.1000 1990 16.76% 5.39% 2.0000 1991 19.75% 4.25% 3.3322 1992 13.64% 3.03% 3.3386 1993 12.09% 2.95% 3.3718 1994 8.15% 2.61% 3.3910 1995 15.74% 2.81% 3.3900 1996 7.19% 2.93% 3.3880 1997 4.63% 2.34% 3.3880 1998 3.87% 1.55% 3.3880 1999 3.08% 2.19% 3.4050 2000 2.68% 3.38% 3.6900 2001 2.27% 2.83% 4.4900 2002 2.74% 1.59% 4.5000 2003 4.51% 2.27% 6.1532 2004 11.27% 2.68% 6.1314 2005 4.87% 3.39% 5.7322 2006 7.64% 3.24% 5.7036 2007 9.32% 2.85% 5.5038 2008 18.32% 3.85% 5.5041 2009 11.76% -0.34% 5.4854 2010 11.27% 1.64% 5.8049 2011 10.05% 3.16% 6.0319 2012 7.12% 2.07% 6.3190 2013 9.42% 1.47% 6.9386 2014 10.15% 1.62% 7.1401 2015 10.36% 0.12% 7.7301 2016 13.81% 1.26% 18.2665 2017 29.51% 2.13% 17.7277 2018 14.40% 2.44% 17.9136 2019 9.15% 1.81% 16.0416 81.82% 66.61% 0.19% 0.99% 0.57% -0.03% -0.06% 0.00% 0.00% 0.50% 8.37% 21.68% 0.22% 36.74% -0.35% -6.51% -0.50% -3.50% 0.01% -0.34% 5.82% 3.91% 4.76% 9.81% 2.90% 8.26% 136.30% -2.95% 1.05% -10.45% 0.89% -0.70% -0.56% 1.15% 2.24% 8.59% 1.48% 4.40% 6.47% 14.47% 12.10% 9.63% 6.89% 5.05% 7.95% 8.53% 10.24% 12.55% 27.38% 11.96% 7.34% A E F G H 1 (St-St-1)S.1 Inf_TK - Inf_US 2 3 4 5 6 7 8 9 10 11 12 13 14 15 16 17 18 19 20 21 22 23 24 25 26 27 28 29 30 31 32 33 A B Year Inf_TK Inf_US S (TL/S) 1989 63.13% 4.83% 0.0023 1990 60.36% 5.39% 0.0029 1991 65.69% 4.25% 0.0051 1992 70.62% 3.03% 0.0086 1993 65.64% 2.95% 0.0145 1994 103.17% 2.61% 0.0387 1995 92.44% 2.81% 0.0597 1996 80.37% 2.93% 0.1078 1997 84.46% 2.34% 0.2056 1998 86.66% 1.55% 0.3145 1999 64.76% 2.19% 0.5414 2000 56.43% 3.38% 0.6734 2001 53.46% 2.83% 1.4501 2002 47.20% 1.59% 1.6437 2003 21.94% 2.27% 1.3966 2004 8.60% 2.68% 1.3395 2005 8.19% 3.39% 1.3451 2006 9.59% 3.24% 1.4090 2007 8.78% 2.85% 1.1708 2008 10.43% 3.85% 1.5255 2009 6.28% -0.34% 1.4909 2010 8.58% 1.64% 1.4901 2011 6.45% 3.16% 1.6029 2012 8.94% 2.07% 1.7868 2013 7.49% 1.47% 2.1382 2014 8.85% 1.62% 2.2610 2015 7.67% 0.12% 2.9211 2016 7.78% 1.26% 3.5288 2017 11.13% 2.13% 3.7753 2018 16.22% 2.44% 5.2858 2019 15.46% 1.81% 5.9454 26.09% 75.86% 68.63% 68.60% 166.90% 54.26% 80.57% 90.72% 52.97% 72.15% 24.38% 115.34% 13.35% -15.03% -4.09% 0.42% 4.75% -16.91% 30.30% -2.27% -0.05% 7.57% 11.47% 19.67% 5.74% 29.20% 20.80% 6.99% 40.01% 12.48% 54.97% 61.44% 67.59% 62.69% 100.56% 89.63% 77.44% 82.12% 85.11% 62.57% 53.05% 50.63% 45.61% 19.67% 5.92% 4.80% 6.35% 5.93% 6.58% 6.62% 6.94% 3.29% 6.87% 6.02% 7.23% 7.55% 6.52% 9.00% 13.78% 13.65% E F G (St-St-1)/S.1 Inf_EG - Inf_US 11.37% 15.50% 10.61% 9.14% 5.54% 12.93% 4.26% 2.29% 2.32% 1 2 3 4 5 6 7 8 9 10 11 12 13 14 15 16 17 18 19 20 21 22 23 24 25 26 27 28 29 30 31 32 33 A B C D Year Inf_EG Inf_US S (EP/S) 1989 21.26% 4.83% 1.1000 1990 16.76% 5.39% 2.0000 1991 19.75% 4.25% 3.3322 1992 13.64% 3.03% 3.3386 1993 12.09% 2.95% 3.3718 1994 8.15% 2.61% 3.3910 1995 15.74% 2.81% 3.3900 1996 7.19% 2.93% 3.3880 1997 4.63% 2.34% 3.3880 1998 3.87% 1.55% 3.3880 1999 3.08% 2.19% 3.4050 2000 2.68% 3.38% 3.6900 2001 2.27% 2.83% 4.4900 2002 2.74% 1.59% 4.5000 2003 4.51% 2.27% 6.1532 2004 11.27% 2.68% 6.1314 2005 4.87% 3.39% 5.7322 2006 7.64% 3.24% 5.7036 2007 9.32% 2.85% 5.5038 2008 18.32% 3.85% 5.5041 2009 11.76% -0.34% 5.4854 2010 11.27% 1.64% 5.8049 2011 10.05% 3.16% 6.0319 2012 7.12% 2.07% 6.3190 2013 9.42% 1.47% 6.9386 2014 10.15% 1.62% 7.1401 2015 10.36% 0.12% 7.7301 2016 13.81% 1.26% 18.2665 2017 29.51% 2.13% 17.7277 2018 14.40% 2.44% 17.9136 2019 9.15% 1.81% 16.0416 81.82% 66.61% 0.19% 0.99% 0.57% -0.03% -0.06% 0.00% 0.00% 0.50% 8.37% 21.68% 0.22% 36.74% -0.35% -6.51% -0.50% -3.50% 0.01% -0.34% 5.82% 3.91% 4.76% 9.81% 2.90% 8.26% 136.30% -2.95% 1.05% -10.45% 0.89% -0.70% -0.56% 1.15% 2.24% 8.59% 1.48% 4.40% 6.47% 14.47% 12.10% 9.63% 6.89% 5.05% 7.95% 8.53% 10.24% 12.55% 27.38% 11.96% 7.34% A E F G H 1 (St-St-1)S.1 Inf_TK - Inf_US 2 3 4 5 6 7 8 9 10 11 12 13 14 15 16 17 18 19 20 21 22 23 24 25 26 27 28 29 30 31 32 33 A B Year Inf_TK Inf_US S (TL/S) 1989 63.13% 4.83% 0.0023 1990 60.36% 5.39% 0.0029 1991 65.69% 4.25% 0.0051 1992 70.62% 3.03% 0.0086 1993 65.64% 2.95% 0.0145 1994 103.17% 2.61% 0.0387 1995 92.44% 2.81% 0.0597 1996 80.37% 2.93% 0.1078 1997 84.46% 2.34% 0.2056 1998 86.66% 1.55% 0.3145 1999 64.76% 2.19% 0.5414 2000 56.43% 3.38% 0.6734 2001 53.46% 2.83% 1.4501 2002 47.20% 1.59% 1.6437 2003 21.94% 2.27% 1.3966 2004 8.60% 2.68% 1.3395 2005 8.19% 3.39% 1.3451 2006 9.59% 3.24% 1.4090 2007 8.78% 2.85% 1.1708 2008 10.43% 3.85% 1.5255 2009 6.28% -0.34% 1.4909 2010 8.58% 1.64% 1.4901 2011 6.45% 3.16% 1.6029 2012 8.94% 2.07% 1.7868 2013 7.49% 1.47% 2.1382 2014 8.85% 1.62% 2.2610 2015 7.67% 0.12% 2.9211 2016 7.78% 1.26% 3.5288 2017 11.13% 2.13% 3.7753 2018 16.22% 2.44% 5.2858 2019 15.46% 1.81% 5.9454 26.09% 75.86% 68.63% 68.60% 166.90% 54.26% 80.57% 90.72% 52.97% 72.15% 24.38% 115.34% 13.35% -15.03% -4.09% 0.42% 4.75% -16.91% 30.30% -2.27% -0.05% 7.57% 11.47% 19.67% 5.74% 29.20% 20.80% 6.99% 40.01% 12.48% 54.97% 61.44% 67.59% 62.69% 100.56% 89.63% 77.44% 82.12% 85.11% 62.57% 53.05% 50.63% 45.61% 19.67% 5.92% 4.80% 6.35% 5.93% 6.58% 6.62% 6.94% 3.29% 6.87% 6.02% 7.23% 7.55% 6.52% 9.00% 13.78% 13.65%