Answered step by step
Verified Expert Solution
Question
1 Approved Answer
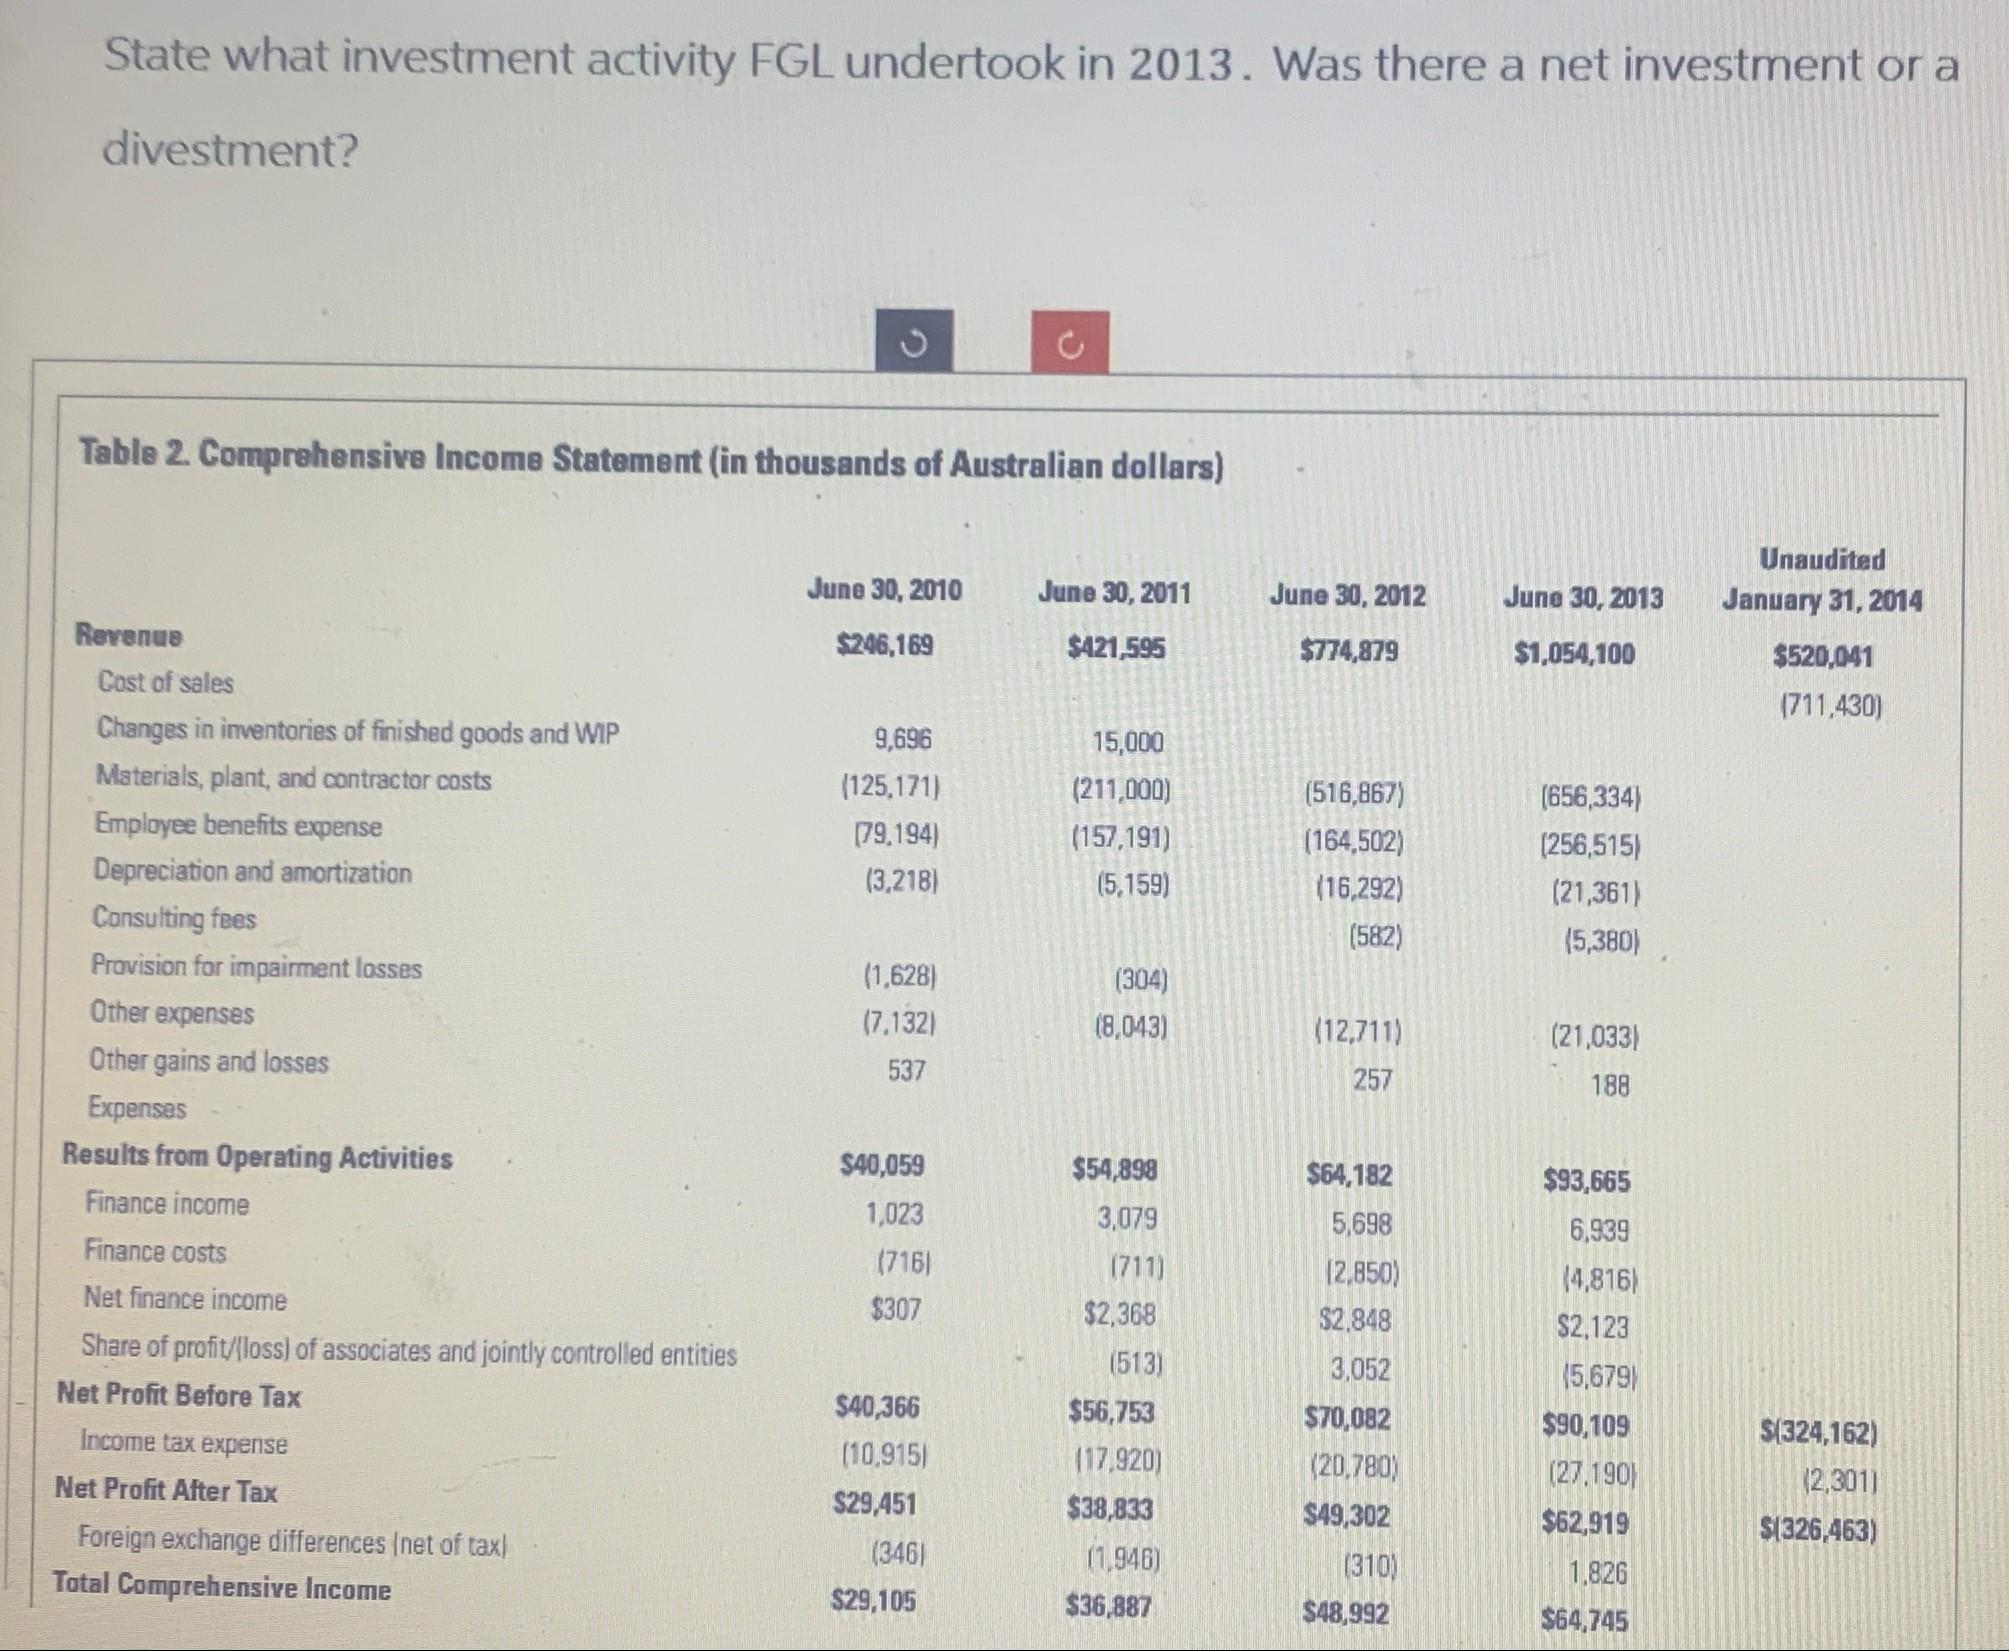
State what investment activity FGL undertook in 2013. Was there a net investment or a divestment? Table 2. Comprehensive Income Statement (in thousands of

State what investment activity FGL undertook in 2013. Was there a net investment or a divestment? Table 2. Comprehensive Income Statement (in thousands of Australian dollars) Revenue June 30, 2010 June 30, 2011 June 30, 2012 June 30, 2013 Unaudited January 31, 2014 $246,169 $421,595 $774,879 $1,054,100 $520,041 (711,430) Cost of sales Changes in inventories of finished goods and WIP 9,696 15,000 Materials, plant, and contractor costs (125,171) (211,000) (516,867) (656,334) Employee benefits expense (79,194) (157,191) (164,502) (256,515) Depreciation and amortization (3,218) (5,159) (16,292) (21,361) Consulting fees (582) (5,380) Provision for impairment losses (1,628) (304) Other expenses (7,132) (8,043) (12,711) (21,033) Other gains and losses 537 257 188 Expenses Results from Operating Activities $40,059 $54,898 $64,182 $93,665 Finance income 1,023 3,079 5,698 6,939 Finance costs (716) (711) (2,850) (4,816) Net finance income $307 $2,368 $2.848 $2,123 Share of profit/(loss) of associates and jointly controlled entities (513) 3,052 (5,679) Net Profit Before Tax $40,366 $56,753 $70,082 $90,109 $(324,162) Income tax expense (10,915) (17,920) (20,780) (27.190) (2,301) Net Profit After Tax $29,451 $38,833 $49,302 $62,919 $(326,463) Foreign exchange differences (net of tax) (346) (1,946) (310) 1.826 Total Comprehensive Income $29,105 $36,887 $48,992 $64,745
Step by Step Solution
There are 3 Steps involved in it
Step: 1
Answer From the provided Comprehensive Income Statement for FGL from the years 2010 through January ...
Get Instant Access to Expert-Tailored Solutions
See step-by-step solutions with expert insights and AI powered tools for academic success
Step: 2

Step: 3

Ace Your Homework with AI
Get the answers you need in no time with our AI-driven, step-by-step assistance
Get Started


