Answered step by step
Verified Expert Solution
Link Copied!

Question

1 Approved Answer

statistic and probability The population of kindergarten students in a particular state is 15,292 individuals. One variable of interest was their reading level measured at

statistic and probability
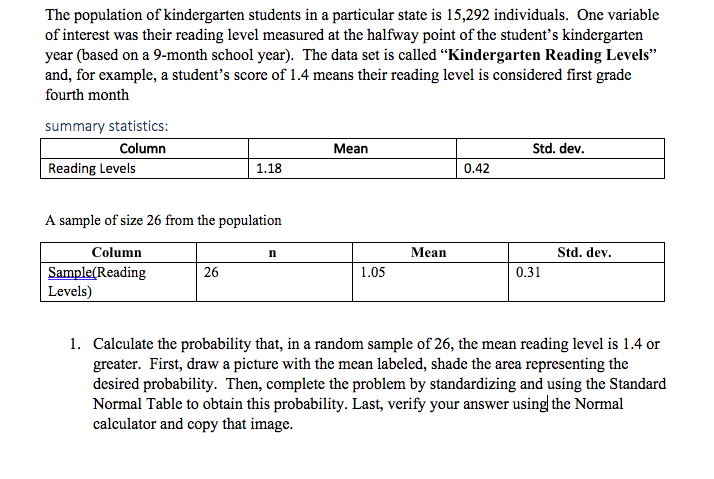
image text in transcribed
The population of kindergarten students in a particular state is 15,292 individuals. One variable of interest was their reading level measured at the halfway point of the student's kindergarten year (based on a 9-month school year). The data set is called "Kindergarten Reading Levels" and, for example, a student's score of 1.4 means their reading level is considered first grade fourth month summary statistics: Column Mean Std. dev. Reading Levels 1.18 0.42 A sample of size 26 from the population Column n Mean Std. dev. Sample( Reading 26 1.05 0.31 Levels) 1. Calculate the probability that, in a random sample of 26, the mean reading level is 1.4 or greater. First, draw a picture with the mean labeled, shade the area representing the desired probability. Then, complete the problem by standardizing and using the Standard Normal Table to obtain this probability. Last, verify your answer using the Normal calculator and copy that image

Step by Step Solution

There are 3 Steps involved in it

Step: 1

blur-text-image

Get Instant Access to Expert-Tailored Solutions

See step-by-step solutions with expert insights and AI powered tools for academic success

Step: 2

blur-text-image_2

Step: 3

blur-text-image_3

Ace Your Homework with AI

Get the answers you need in no time with our AI-driven, step-by-step assistance

Get Started

Recommended Textbook for

Elementary Statisitcs

Authors: Barry Monk

2nd edition

1259345297, 978-0077836351, 77836359, 978-1259295911, 1259295915, 978-1259292484, 1259292487, 978-1259345296

More Books

Students also viewed these Mathematics questions

Question

Is the graphic clearly labeled? (p. 195)

Answered: 1 week ago