Answered step by step
Verified Expert Solution
Link Copied!

Question

1 Approved Answer

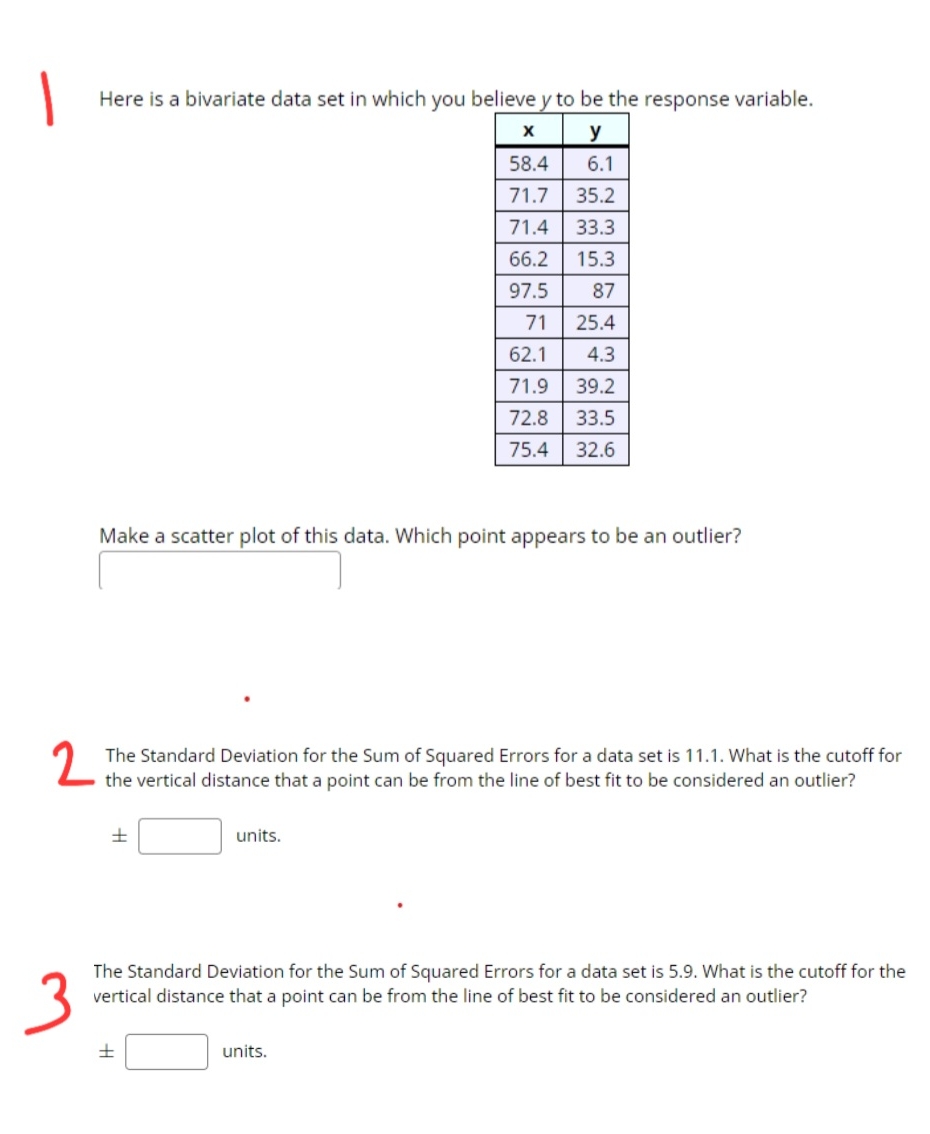
Statistics and Probability Here is a bivariate data set in which you believe y to be the response variable. X y 58.4 6.1 71.7 35.2

Statistics and Probability

image text in transcribed
Here is a bivariate data set in which you believe y to be the response variable. X y 58.4 6.1 71.7 35.2 71.4 33.3 66.2 15.3 97.5 87 71 25.4 62.1 4.3 71.9 39.2 72.8 33.5 75.4 32.6 Make a scatter plot of this data. Which point appears to be an outlier? 2 The Standard Deviation for the Sum of Squared Errors for a data set is 11.1. What is the cutoff for the vertical distance that a point can be from the line of best fit to be considered an outlier? F units. The Standard Deviation for the Sum of Squared Errors for a data set is 5.9. What is the cutoff for the N vertical distance that a point can be from the line of best fit to be considered an outlier? F units

Step by Step Solution

There are 3 Steps involved in it

Step: 1

blur-text-image

Get Instant Access to Expert-Tailored Solutions

See step-by-step solutions with expert insights and AI powered tools for academic success

Step: 2

blur-text-image

Step: 3

blur-text-image

Ace Your Homework with AI

Get the answers you need in no time with our AI-driven, step-by-step assistance

Get Started

Recommended Textbook for

Introduction To Probability Models

Authors: Sheldon M Ross

10th Edition

0123756863, 9780123756862

More Books

Students also viewed these Mathematics questions