
STATISTICS AND PROBABILITY
MODULE 6: NORMAL DISTRIBUTION
IDENTIFYING REGIONS IF AREAS UNDER THE NORMAL CURVE.
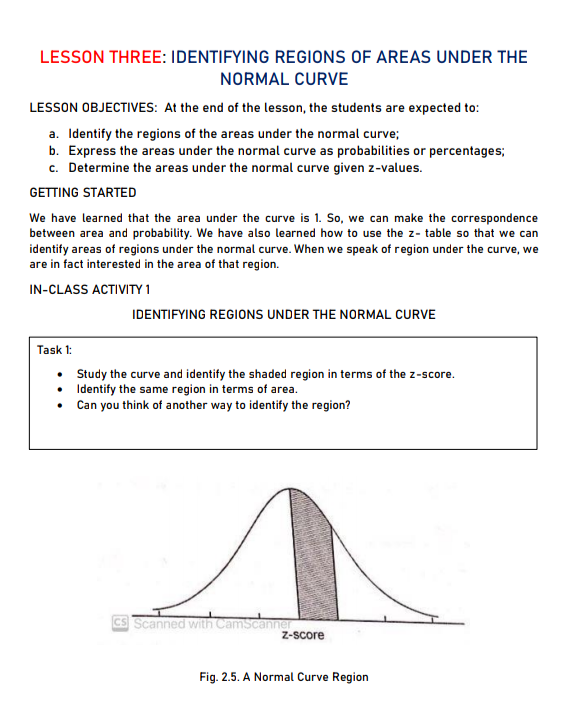
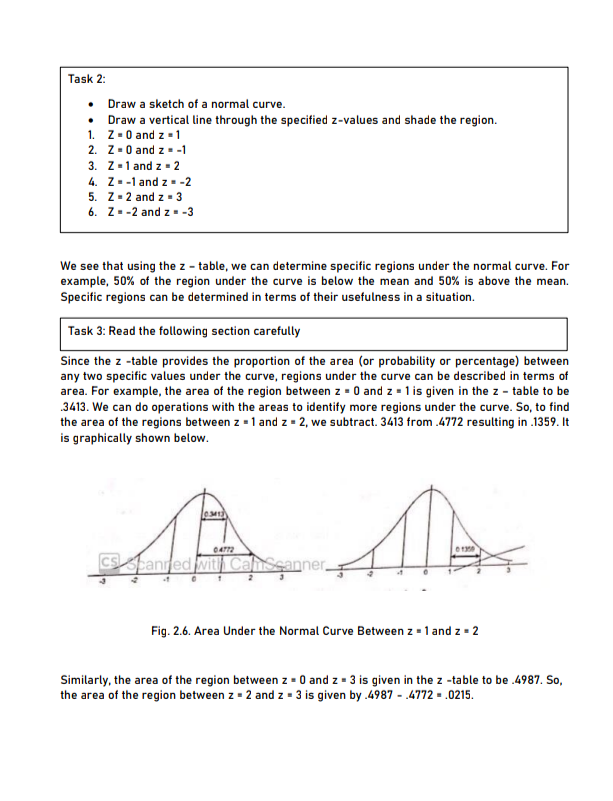
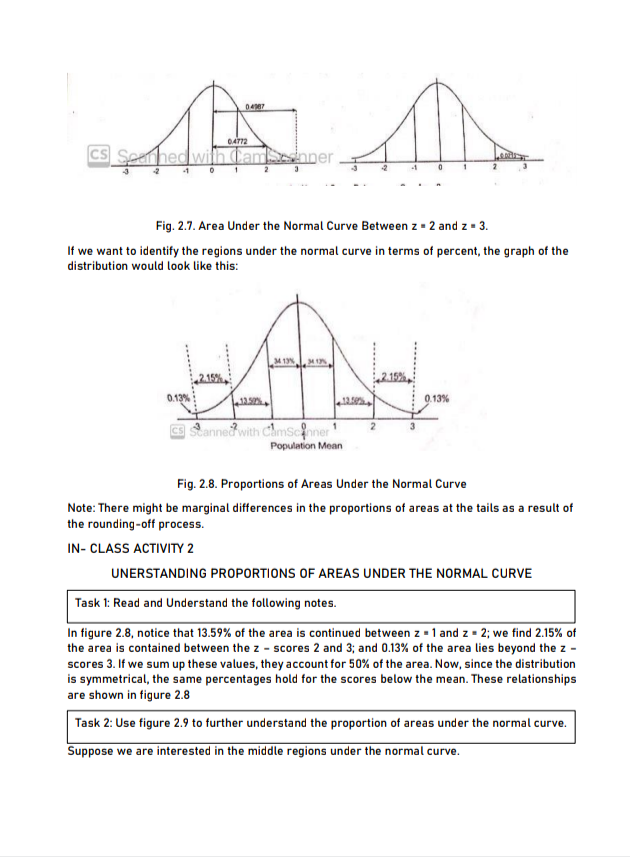
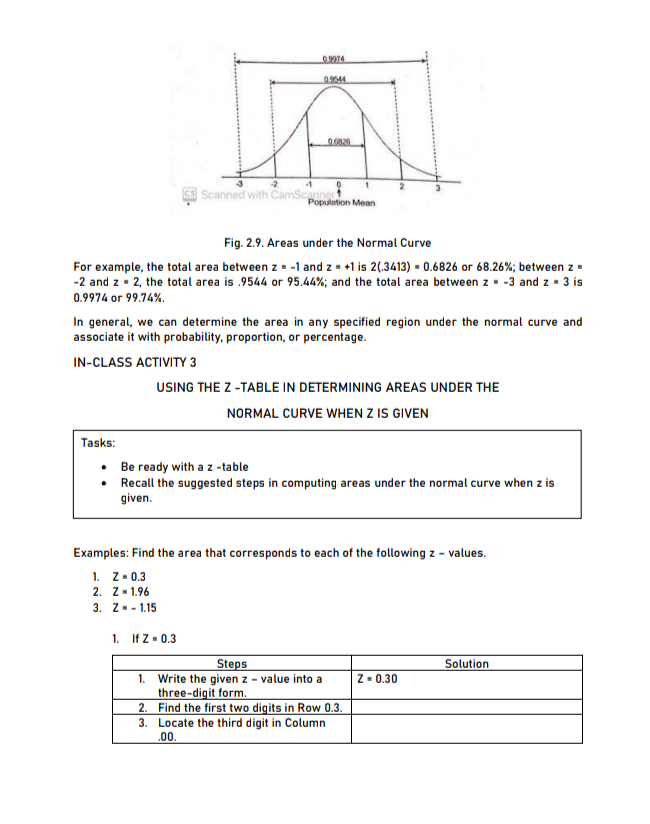
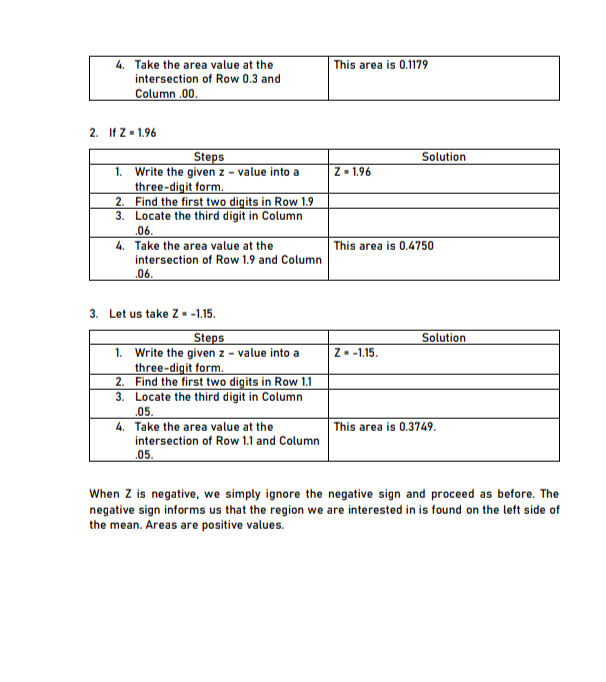
LESSON THREE: IDENTIFYING REGIONS OF AREAS UNDER THE NORMAL CURVE LESSON OBJECTIVES: At the end of the lesson, the students are expected to: a. Identify the regions of the areas under the normal curve; b. Express the areas under the normal curve as probabilities or percentages; c. Determine the areas under the normal curve given z-values. GETTING STARTED We have learned that the area under the curve is 1. So, we can make the correspondence between area and probability. We have also learned how to use the z- table so that we can identify areas of regions under the normal curve. When we speak of region under the curve, we are in fact interested in the area of that region. IN-CLASS ACTIVITY 1 IDENTIFYING REGIONS UNDER THE NORMAL CURVE Task 1: Study the curve and identify the shaded region in terms of the z-score. Identify the same region in terms of area. Can you think of another way to identify the region? cs Scanned with CamScanner z-score Fig. 2.5. A Normal Curve RegionTask 2: Draw a sketch of a normal curve. Draw a vertical line through the specified z-values and shade the region. 1. Z - 0 and z = 1 2. Z - 0 and z = -1 3. Z - 1 and z - 2 4. Z - -1 and z - -2 5. Z - 2 and z = 3 6. Z - -2 and z = -3 We see that using the z - table, we can determine specific regions under the normal curve. For example, 50% of the region under the curve is below the mean and 50% is above the mean. Specific regions can be determined in terms of their usefulness in a situation. Task 3: Read the following section carefully Since the z -table provides the proportion of the area (or probability or percentage) between any two specific values under the curve, regions under the curve can be described in terms of area. For example, the area of the region between z = 0 and z = 1 is given in the z - table to be 3413. We can do operations with the areas to identify more regions under the curve. So, to find the area of the regions between z = 1 and z = 2, we subtract. 3413 from .4772 resulting in .1359. It is graphically shown below. csi Scanned with CamSe Fig. 2.6. Area Under the Normal Curve Between z = 1 and z = 2 Similarly, the area of the region between z = 0 and z - 3 is given in the z -table to be .4987. So, the area of the region between z = 2 and z = 3 is given by .4987 - .4772 - .0215.D 4287 04772 cs Scanned with CamScanner Fig. 2.7. Area Under the Normal Curve Between z = 2 and z = 3. If we want to identify the regions under the normal curve in terms of percent, the graph of the distribution would look like this: M1MIN 1-215% 0.13% : 9.13% CS Scanned with CamScanner Population Mean Fig. 2.8. Proportions of Areas Under the Normal Curve Note: There might be marginal differences in the proportions of areas at the tails as a result of the rounding-off process. IN- CLASS ACTIVITY 2 UNERSTANDING PROPORTIONS OF AREAS UNDER THE NORMAL CURVE Task 1: Read and Understand the following notes. In figure 2.8, notice that 13.59% of the area is continued between z = 1 and z = 2; we find 2.15% of the area is contained between the z - scores 2 and 3; and 0.13% of the area lies beyond the z - scores 3. If we sum up these values, they account for 50% of the area. Now, since the distribution is symmetrical, the same percentages hold for the scores below the mean. These relationships are shown in figure 2.8 Task 2: Use figure 2.9 to further understand the proportion of areas under the normal curve. Suppose we are interested in the middle regions under the normal curve.0.9274 CS Scanned with CamSc Population Mean Fig. 2.9. Areas under the Normal Curve For example, the total area between z = -1 and z = +1 is 2(.3413) = 0.6826 or 68.26%; between z = -2 and z = 2, the total area is .9544 or 95.44%; and the total area between z = -3 and z = 3 is 0.9974 or 99.74%. In general, we can determine the area in any specified region under the normal curve and associate it with probability, proportion, or percentage. IN-CLASS ACTIVITY 3 USING THE Z -TABLE IN DETERMINING AREAS UNDER THE NORMAL CURVE WHEN Z IS GIVEN Tasks: Be ready with a z -table . Recall the suggested steps in computing areas under the normal curve when z is given. Examples: Find the area that corresponds to each of the following z - values. 1. Z - 0.3 2. Z - 1.96 3. Z - - 1.15 1. If Z - 0.3 Steps Solution 1. Write the given z - value into a Z - 0.30 three-digit form. 2. Find the first two digits in Row 0.3. 3. Locate the third digit in Column 00.4. Take the area value at the This area is 0.1179 intersection of Row 0.3 and Column .00 2. If Z - 1.96 Steps Solution 1. Write the given z - value into a Z - 1.96 three-digit form. 2. Find the first two digits in Row 1.9 3. Locate the third digit in Column 06. 4. Take the area value at the This area is 0.4750 intersection of Row 1.9 and Column 06. 3. Let us take Z - -1.15. Steps Solution 1. Write the given z - value into a Z - -1.15. three-digit form. 2. Find the first two digits in Row 1.1 3. Locate the third digit in Column 05. 4. Take the area value at the This area is 0.3749. intersection of Row 1.1 and Column 05. When Z is negative, we simply ignore the negative sign and proceed as before. The negative sign informs us that the region we are interested in is found on the left side of the mean. Areas are positive values.EXERCISES A. Use the Z - table to find the area that corresponds to each of the following. 1. Z. .56 2. Z - 1.32 3. Z - -1.05 4. Z- -2.18 5. Z. -2.58 B. Do the indicated task. 1. Explain why the proportion of the area to the left of Z - -2.58 is .49%. 2. Explain why the total area of the region between z = -3 and Z - 3 is .9974 or 99.74%