Answered step by step
Verified Expert Solution
Link Copied!

Question

1 Approved Answer

Statistics and Probability The following data represents the age of 30 lottery winners. 21 32 33 33 36 38 38 41 45 47 48 51

Statistics and Probability

image text in transcribed
The following data represents the age of 30 lottery winners. 21 32 33 33 36 38 38 41 45 47 48 51 51 52 53 53 58 58 66 69 59 70 71 72 74 75 75 78 85 Complete the frequency distribution for the data. Age Frequency 20-29 30-39 40-49 50-59 60-69 70-79 80-89 A group of adults were asked how many children they have in their families. The bar graph below 2 shows the number of adults who indicated each number of children. 3.5 w 2.5- 2- 1.5 0.5 0 1 2 3 4 5 Number of Children Q How many adults were questioned? What percentage of the adults questioned had 0 children

Step by Step Solution

There are 3 Steps involved in it

Step: 1

blur-text-image

Get Instant Access to Expert-Tailored Solutions

See step-by-step solutions with expert insights and AI powered tools for academic success

Step: 2

blur-text-image

Step: 3

blur-text-image

Ace Your Homework with AI

Get the answers you need in no time with our AI-driven, step-by-step assistance

Get Started

Recommended Textbook for

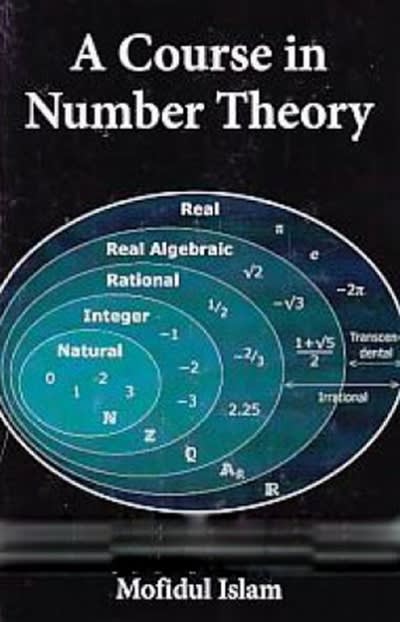
A Course In Number Theory

Authors: Mofidul Islam

1st Edition

9353147069, 9789353147068

More Books

Students also viewed these Mathematics questions