STATISTICS ANOVA, ANCOVA, REGRESSION, RSTUDIO Directions: Answer the following questions inside the picture and choose the correct answer. Explain why it is the correct answer.
STATISTICS
ANOVA, ANCOVA, REGRESSION, RSTUDIO
Directions: Answer the following questions inside the picture and choose the correct answer. Explain why it is the correct answer. All the details for the question is indicated in the picture for each number.
1.
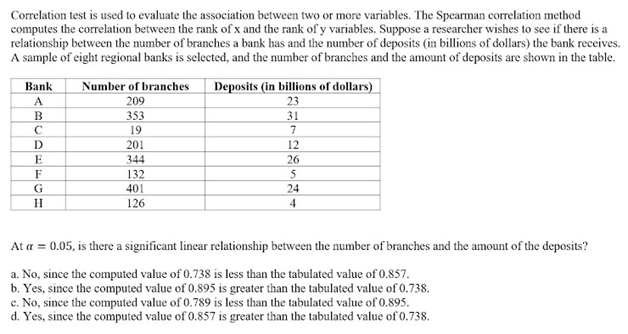
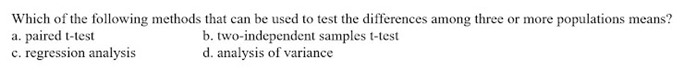
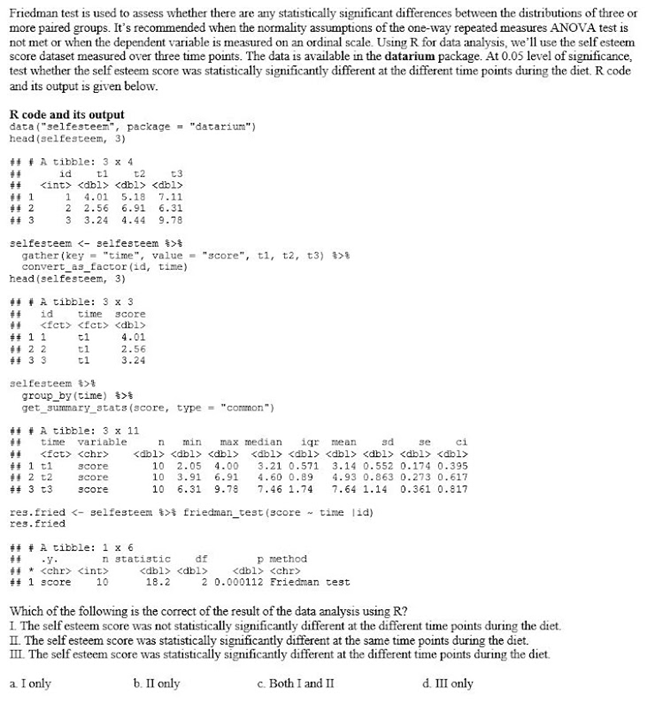
Friedman test is used to assess whether there are any statistically significant differences between the distributions of three or more paired groups. It's recommended when the normality assumptions of the one-way repeated measures ANOVA test is not met or when the dependent variable is measured on an ordinal scale. Using R for data analysis, we'll use the self esteem score dataset measured over three time points. The data is available in the datarium package. At 0.05 level of significance, test whether the self esteem score was statistically significantly different at the different time points during the diet. R code and its output is given below. R code and its output data ("selfesteem", package . "datarium") head (selfesteem, 3) ## # A tibble: 3 x 4 id t1 E2 1 4. 01 5.18 7.11 2 2.56 6.91 6.31 3 3.24 4.44 9.78 selfesteem $ gather (key = "time", value = "score", t1, t2, t3) 178 convert_as_factor (id, time) head (selfesteem, 3) If A tibble: 3 x 3 id time score 1 1 4.01 2 2.56 3.24 selfesteem 131 group by (time) $>$ get_summary stats (score, type . "common") If # A tibble: 3 x 11 time variable min max median iqr mean ad 1 score 10 2. 05 4.00 3.21 0.571 3.14 0. 552 0.174 0.395 2 2 score 10 3.91 6.91 4.60 0.89 4.93 0. 863 0.273 0.617 ## 3 23 score 10 6.31 9.78 7. 46 1.74 7. 64 1.14 0.361 0.817 res. fried 1 friedman_test (score ~ ## 1 score 10 18.2 2 0. 000112 Friedman test Which of the following is the correct of the result of the data analysis using R? I. The self esteem score was not statistically significantly different at the different time points during the diet. II. The self esteem score was statistically significantly different at the same time points during the diet. III. The self esteem score was statistically significantly different at the different time points during the diet a I only b. II only c. Both I and II d. III onlyCorrelation test is used to evaluate the association between two or more variables. The Spearman correlation method computes the correlation between the rank of x and the rank of y variables. Suppose a researcher wishes to see if there is a relationship between the number of branches a bank has and the number of deposits (in billions of dollars) the bank receives. A sample of eight regional banks is selected, and the number of branches and the amount of deposits are shown in the table. Bank Number of branches Deposits (in billions of dollars) A 209 23 B 353 31 C 19 D 201 12 344 26 132 5 401 24 HI 126 4 At ar = 0.05, is there a significant linear relationship between the number of branches and the amount of the deposits? a. No, since the computed value of 0.738 is less than the tabulated value of 0.857. b. Yes, since the computed value of 0.895 is greater than the tabulated value of 0.738. c. No, since the computed value of 0.789 is less than the tabulated value of 0.895. d. Yes, since the computed value of 0.857 is greater than the tabulated value of 0.738.Which of the following methods that can be used to test the differences among three or more populations means? a. paired t-test b. two-independent samples t-test c. regression analysis d. analysis of variance
Step by Step Solution
There are 3 Steps involved in it
Step: 1
Get Instant Access to Expert-Tailored Solutions
See step-by-step solutions with expert insights and AI powered tools for academic success
Step: 2
Step: 3
Ace Your Homework with AI
Get the answers you need in no time with our AI-driven, step-by-step assistance