

Answered step by step
Verified Expert Solution
Question
1 Approved Answer
Statistics application for Financial Data Analytics. Thank you for the help!! Investment analysts often use earnings per share (EPS) forecasts. One test of forecasting quality
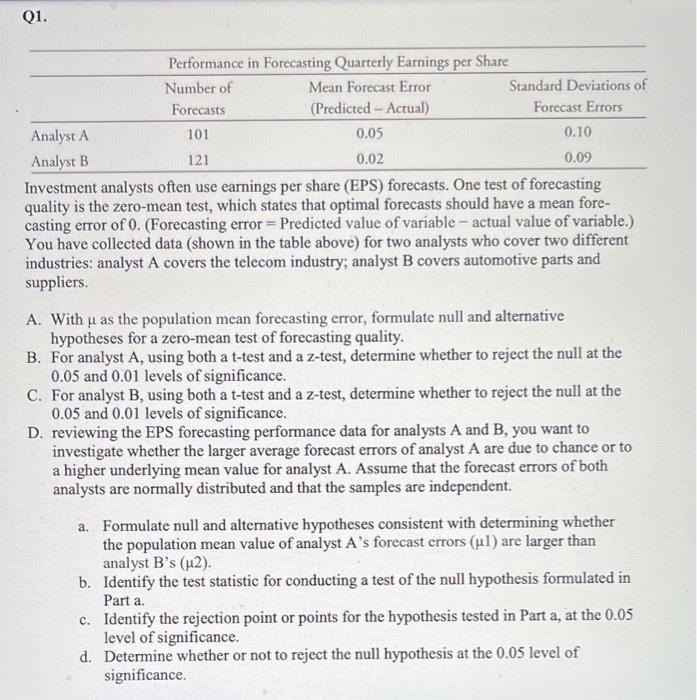
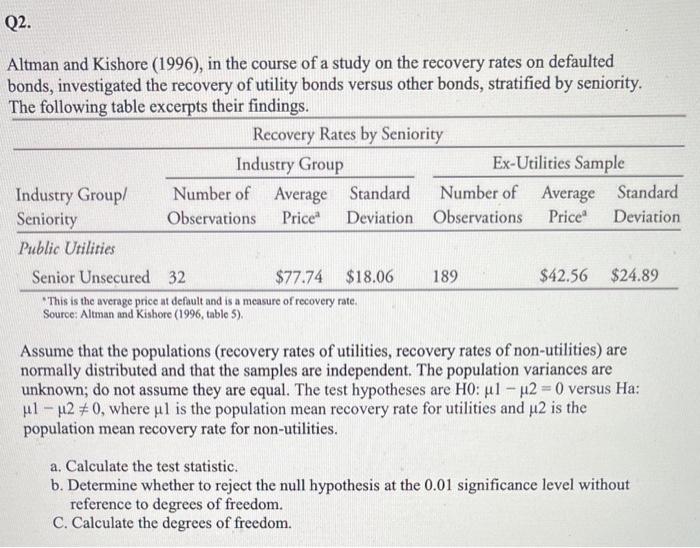 Statistics application for Financial Data Analytics. Thank you for the help!! Investment analysts often use earnings per share (EPS) forecasts. One test of forecasting quality is the zero-mean test, which states that optimal forecasts should have a mean forecasting error of 0 . (Forecasting error = Predicted value of variable - actual value of variable.) You have collected data (shown in the table above) for two analysts who cover two different industries: analyst A covers the telecom industry; analyst B covers automotive parts and suppliers. A. With as the population mean forecasting error, formulate null and alternative hypotheses for a zero-mean test of forecasting quality. B. For analyst A, using both a t-test and a z-test, determine whether to reject the null at the 0.05 and 0.01 levels of significance. C. For analyst B, using both a t-test and a z-test, determine whether to reject the null at the 0.05 and 0.01 levels of significance. D. reviewing the EPS forecasting performance data for analysts A and B, you want to investigate whether the larger average forecast errors of analyst A are due to chance or to a higher underlying mean value for analyst A. Assume that the forecast errors of both analysts are normally distributed and that the samples are independent. a. Formulate null and alternative hypotheses consistent with determining whether the population mean value of analyst A's forecast errors (1) are larger than analyst B's (2). b. Identify the test statistic for conducting a test of the null hypothesis formulated in Part a. c. Identify the rejection point or points for the hypothesis tested in Part a, at the 0.05 level of significance. d. Determine whether or not to reject the null hypothesis at the 0.05 level of significance. Altman and Kishore (1996), in the course of a study on the recovery rates on defaulted bonds, investigated the recovery of utility bonds versus other bonds, stratified by seniority. The following table excerpts their findings. "This is the average price at default and is a measure of recovery rate. Source: Altman and Kishore (1996, table 5). Assume that the populations (recovery rates of utilities, recovery rates of non-utilities) are normally distributed and that the samples are independent. The population variances are unknown; do not assume they are equal. The test hypotheses are H0:12=0 versus Ha: 12=0, where 1 is the population mean recovery rate for utilities and 2 is the population mean recovery rate for non-utilities. a. Calculate the test statistic. b. Determine whether to reject the null hypothesis at the 0.01 significance level without reference to degrees of freedom. C. Calculate the degrees of freedom
Step by Step Solution
There are 3 Steps involved in it
Step: 1

Get Instant Access to Expert-Tailored Solutions
See step-by-step solutions with expert insights and AI powered tools for academic success
Step: 2

Step: 3
Ace Your Homework with AI
Get the answers you need in no time with our AI-driven, step-by-step assistance
Get Started