

Answered step by step
Verified Expert Solution
Question
1 Approved Answer
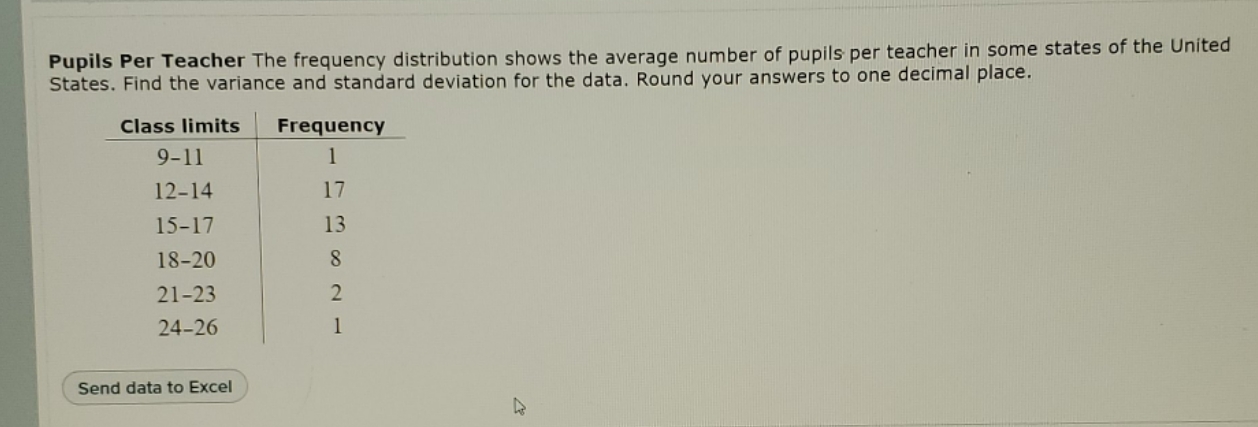
Statistics Pupils Per Teacher The frequency distribution shows the average number of pupils per teacher in some states of the United States. Find the variance
Statistics
Step by Step Solution
There are 3 Steps involved in it
Step: 1

Get Instant Access to Expert-Tailored Solutions
See step-by-step solutions with expert insights and AI powered tools for academic success
Step: 2

Step: 3
Ace Your Homework with AI
Get the answers you need in no time with our AI-driven, step-by-step assistance
Get Started
WebAssign For Trigonometry
Authors: James Stewart
2nd Edition
1337772313, 9781337772310