

Answered step by step
Verified Expert Solution
Question
1 Approved Answer
statistics. Sample mean and mean table, table of sampling distribution, and histogram C. Direction: Create an Observation Sample Mean and Mean Table, Table of Sampling
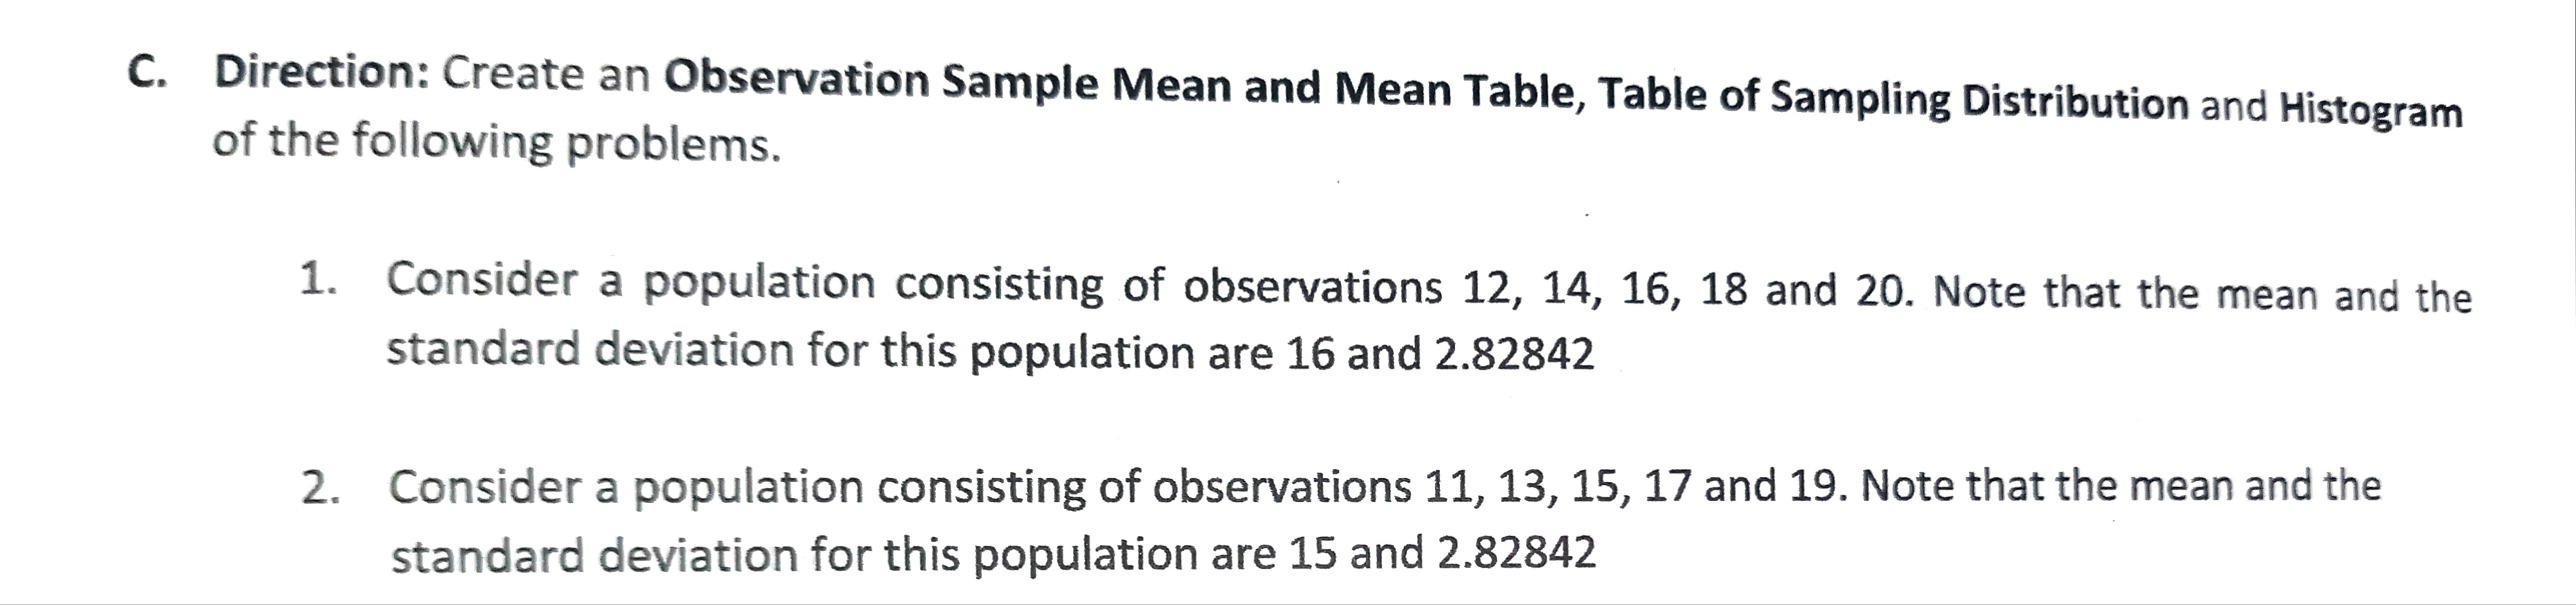
statistics. Sample mean and mean table, table of sampling distribution, and histogram

Step by Step Solution
There are 3 Steps involved in it
Step: 1

Get Instant Access to Expert-Tailored Solutions
See step-by-step solutions with expert insights and AI powered tools for academic success
Step: 2

Step: 3
Ace Your Homework with AI
Get the answers you need in no time with our AI-driven, step-by-step assistance
Get Started
A Preface To Logic
Authors: Morris R Cohen
1st Edition
0486801853, 9780486801858