STATISTICSSTUDENTSSURVEYFORR data: https://docs.google.com/spreadsheets/d/1es_YYMzmby5ojVrv6n_UTAhK0GiUOHPS/edit?usp=sharing&ouid=107183543921619129106&rtpof=true&sd=true , select all the link, right click on it and then click go to the link to open the file! . Use
STATISTICSSTUDENTSSURVEYFORR data:
https://docs.google.com/spreadsheets/d/1es_YYMzmby5ojVrv6n_UTAhK0GiUOHPS/edit?usp=sharing&ouid=107183543921619129106&rtpof=true&sd=true , select all the link, right click on it and then click go to the link to open the file!
.
Use R commander with file data provided to answer the questions please!
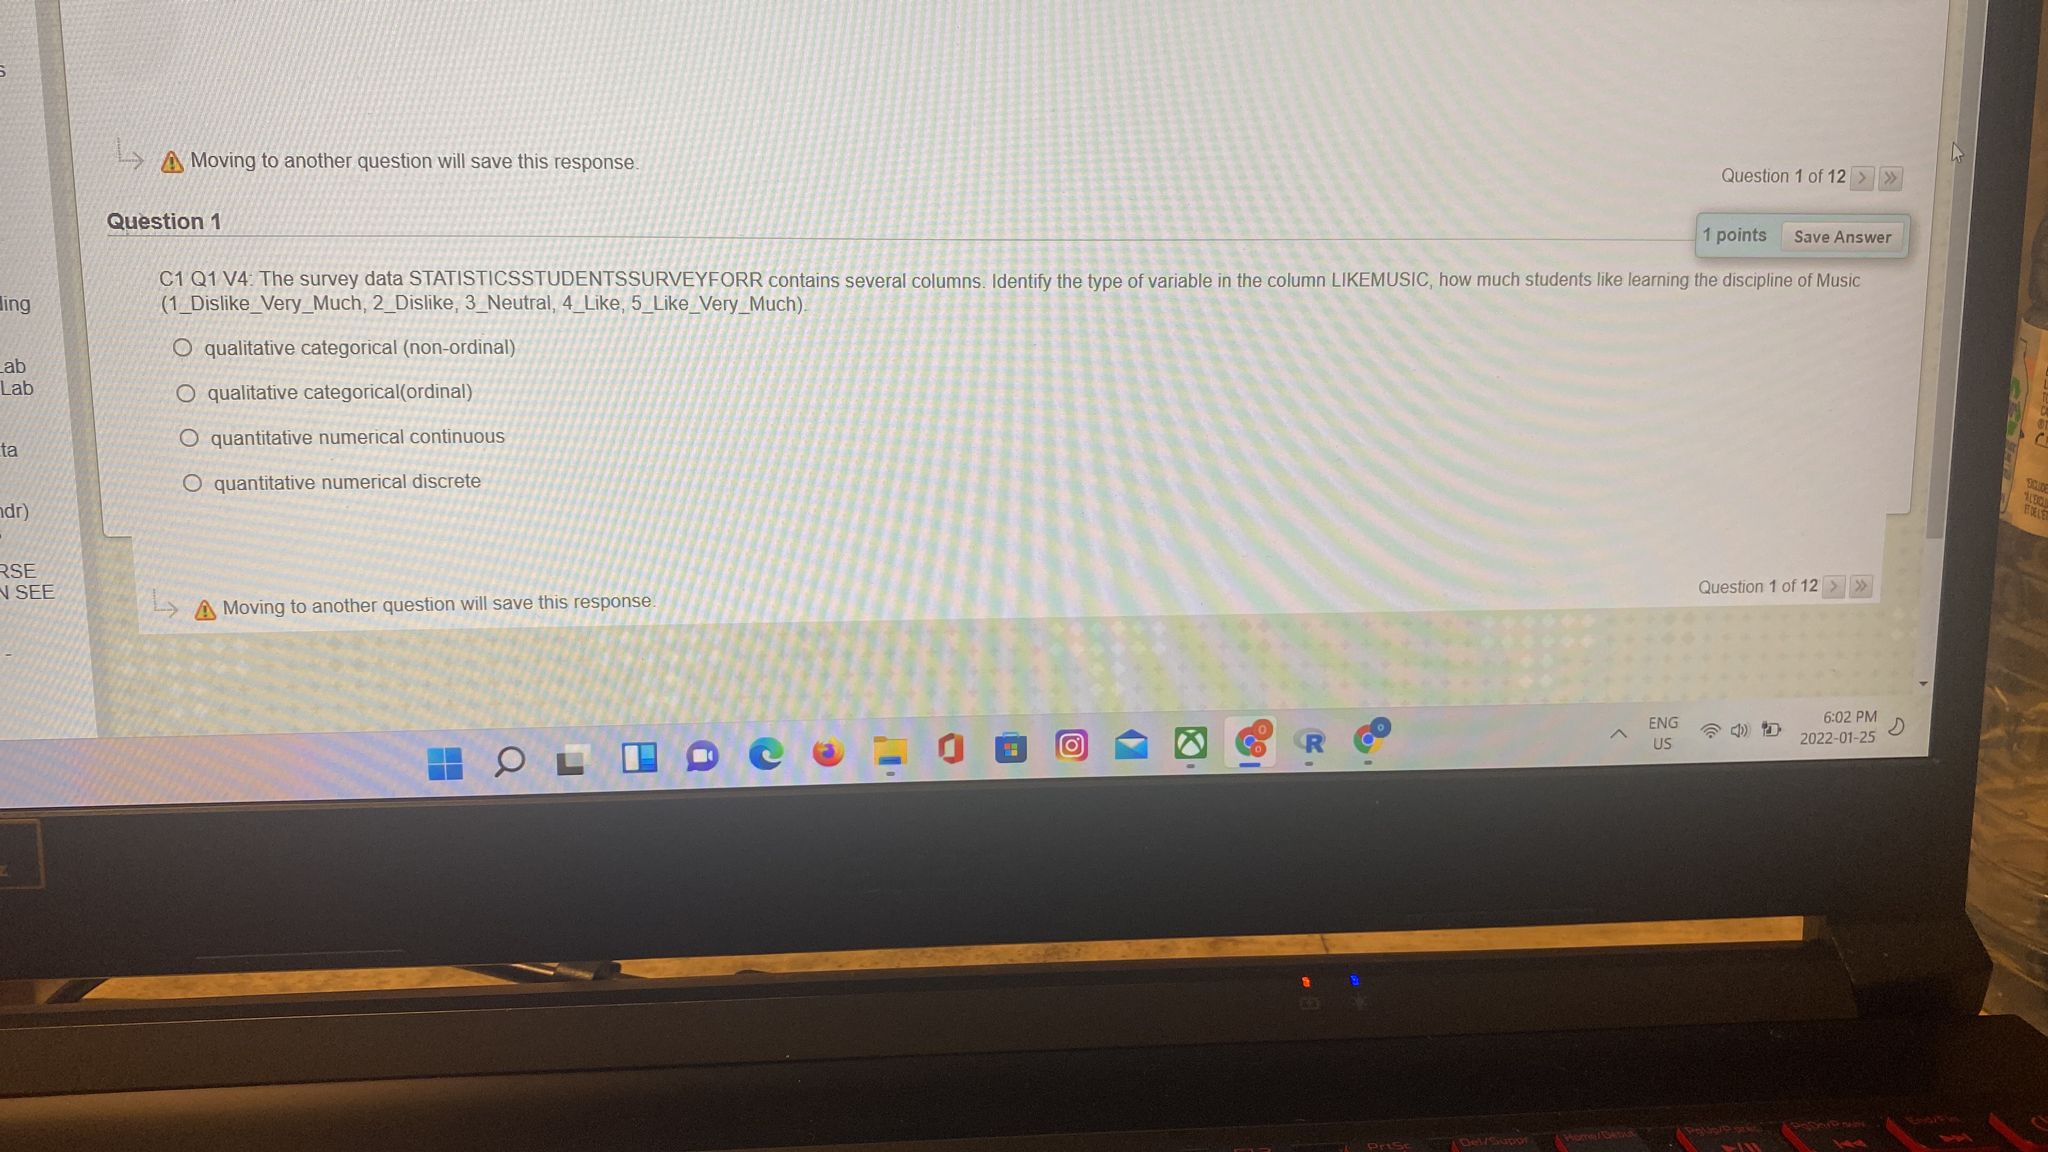
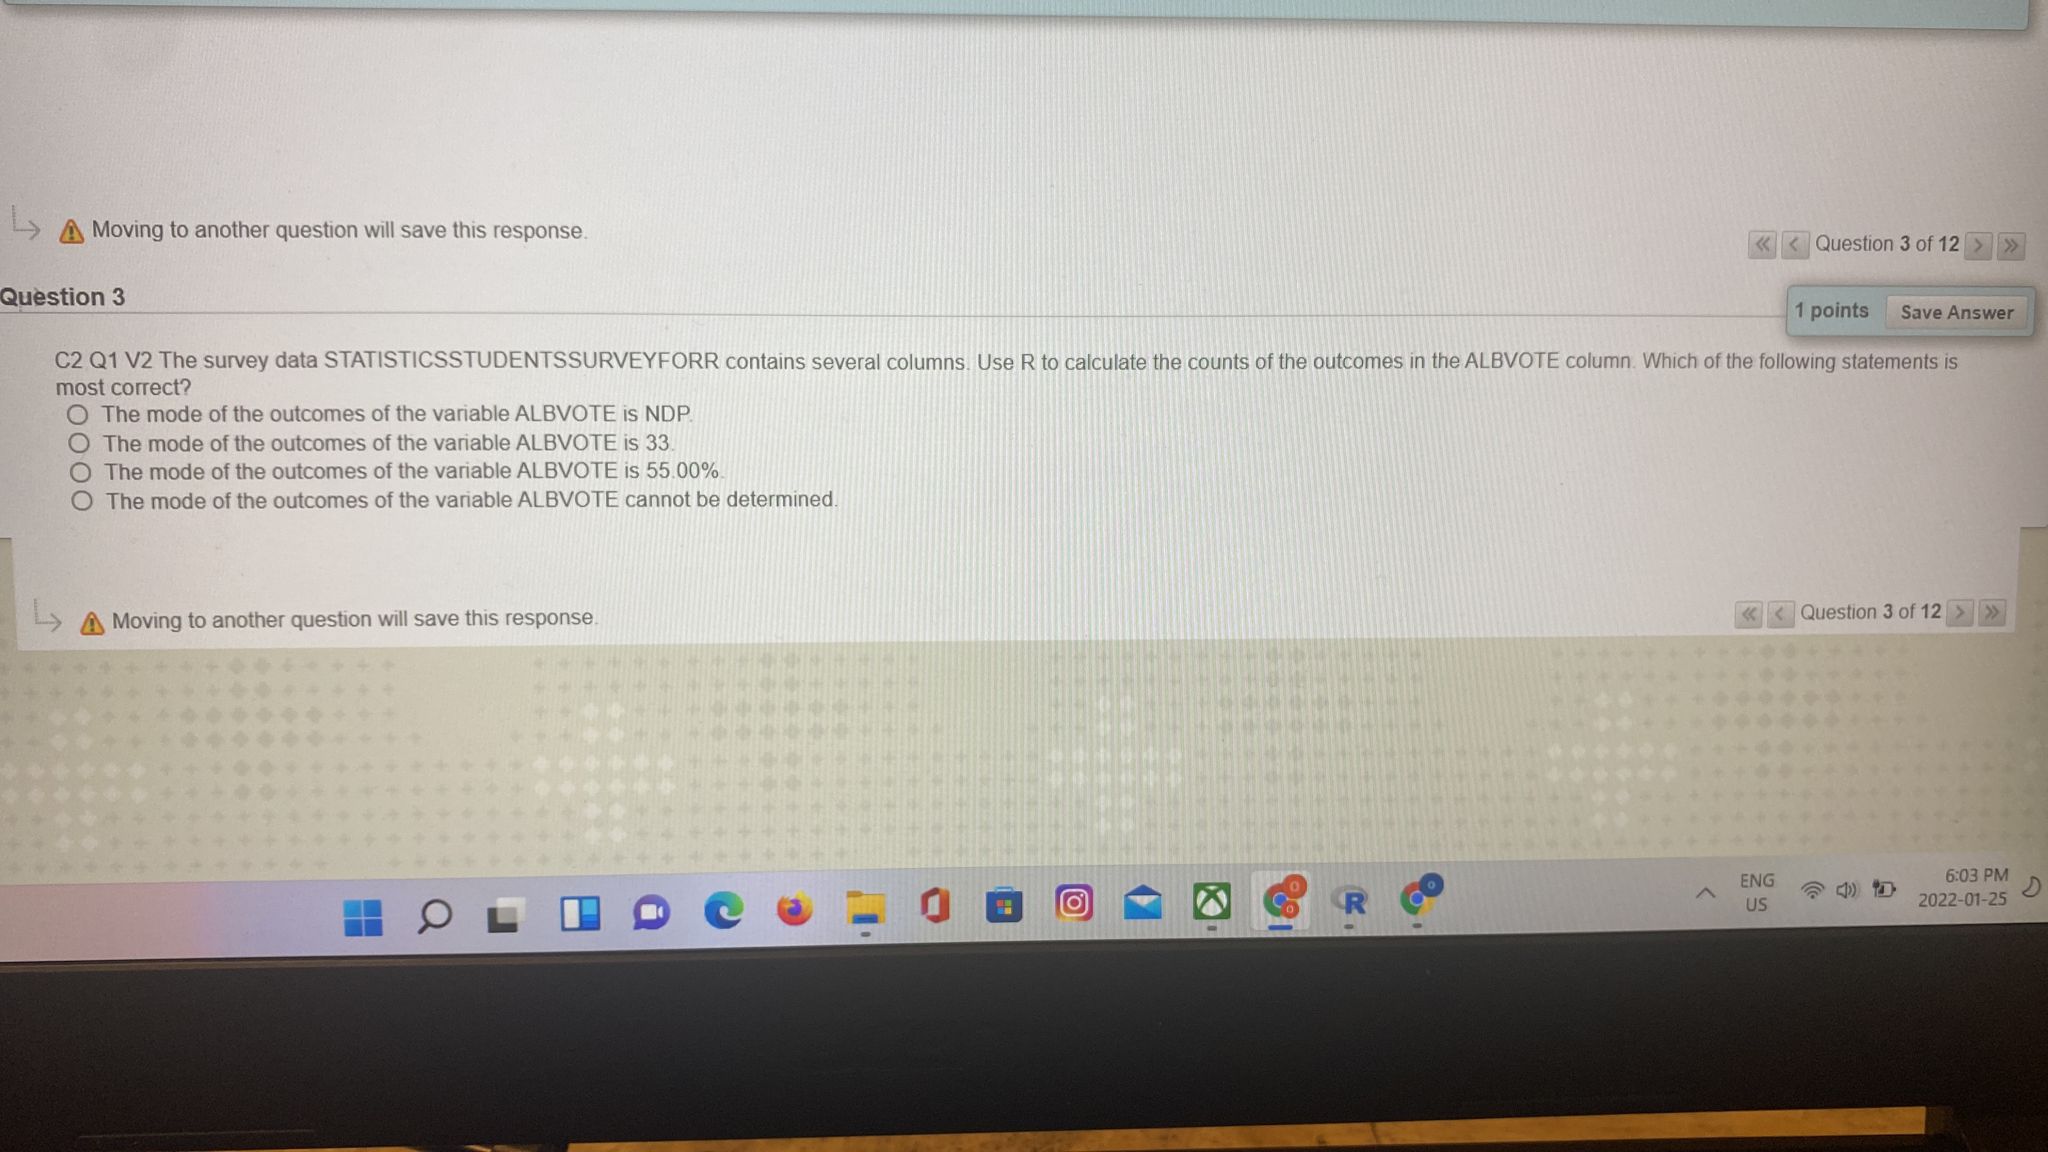
Moving to another question will save this response. Question 1 of 12 > >> Question 1 1 points Save Answer C1 Q1 V4: The survey data STATISTICSSTUDENTSSURVEYFORR contains several columns. Identify the type of variable in the column LIKEMUSIC, how much students like learning the discipline of Music ling (1_Dislike_Very_Much, 2_Dislike, 3_Neutral, 4_Like, 5_Like_Very_Much) qualitative categorical (non-ordinal) ab Lab O qualitative categorical(ordinal) ta O quantitative numerical continuous O quantitative numerical discrete dry SE SEE Moving to another question will save this response. Question 1 of 12 > >> ENG 6:02 PM Co R CO US 2022-01-25 DMoving to another question will save this response. >> Question 2 1 points Save Answer C1 Q2 V4: The survey data STATISTICSSTUDENTSSURVEYFORR contains several columns. Identify the type of variable in the column LIKEMATH, how much students like learning the discipline of Music (1_Dislike_Very_Much, 2_Dislike, 3_Neutral, 4_Like, 5_Like_Very_Much). O qualitative categorical (non-ordinal) O qualitative categorical (ordinal) quantitative numerical discrete O quantitative numerical continuous E SEE Moving to another question will save this response. >> CO ENG 6:03 PM Co R US 2022-01-25Moving to another question will save this response. > Question 3 1 points Save Answer C2 Q1 V2 The survey data STATISTICSSTUDENTSSURVEYFORR contains several columns. Use R to calculate the counts of the outcomes in the ALBVOTE column. Which of the following statements is most correct? The mode of the outcomes of the variable ALBVOTE is NDP. The mode of the outcomes of the variable ALBVOTE is 33. O The mode of the outcomes of the variable ALBVOTE is 55.00% O The mode of the outcomes of the variable ALBVOTE cannot be determined. Moving to another question will save this response. > ENG 6:03 PM Co R CO D US 2022-01-25ngs Moving to another question will save this response. URSE AN SEE R CO ENG 6:03 PM US 2022-01-2Ly Moving to another question will save this response > Question 5 1 points Save Answer C2 Q3 V3 The survey data STATISTICSSTUDENTSSURVEYFORR contains the column MOALPHABET which is a variable that measures the age (in months) at which students first began to say the uding alphabet. Use R to make a histogram with which to describe the data. Choose the most correct answer below to describe what you see in the shape of the data distribution. S right skewed (Lab uniform al Lab O symmetric O left skewed Data cmdr) Moving to another question will save this response les > OURSE CAN SEE Dom - Co R CO ENG 6:03 PM US 2022-01-25 D OHzMoving to another question will save this response. > Question 7 1 points Save Answer C3 Q1 V3 The survey data STATISTICSSTUDENTSSURVEYFORR contains the column NUMPRINTBK (a variable that measures the number of print books owned by a student) and the column FAVBOOK (a variable that measures whether the student prefers to read fiction or nonfiction). Make side by side boxplots for NUMPRINTBK for the Fiction group and the Nonfiction group. Indicate which of the following statements is most correct. The Fiction group has 5 outliers and the Nonfiction group has 1 outlier. The outlier NUMPRINTBK data values in the Fiction group are 29 books, 49 books, 58 books, 44 books, and 1 book. The outlier NUMPRINTBK data value in the Nonfiction group is 12 books. The range for the Fiction group is narrower than the range for the Nonfiction group. Moving to another question will save this response. > EF ENG 6:04 PM R US 2022-01-25>Moving to another question will save this response > Question 8 1 points Save Answer C3 Q8 V4 The survey data STATISTICSSTUDENTSSURVEYFORR contains the column YRSFIRSTPHONE which is a variable that measures the age (in years) at which students obtained their first cell ding phone. Use R to determine the 5 number summary of this column data, Which of the following statements is incorrect? O 75% of this data is above 10.00 Lab 25% of this data is below 10.00 Lab O 25% of this data is above 13.25 O 75% of this data is above 13.25 ata ndr) Moving to another question will save this response. S > CH IRSE IN SEE Co R Co ENG 6:04 PM US 2022-01-25 D> Moving to another question will save this response. > Question 11 1 points Save Answer C3 Q5 V4: The survey data STATISTICSSTUDENTSSURVEYFORR contains the column WKHRSNEWS (a variable that measures the hours per week a student reads the news) and the column JTGOOD (a variable that answers yes or not to whether the student thinks Justin Trudeau is doing a good job. Use R to find the mean and standard deviation for the weekly hours per news for the yes students and the mean and standard deviation for the weekly hours for news for the no students. Choose the most correct answer below. The yes mean is more than the no mean and the yes standard deviation is more than the no standard deviation. The yes mean is less than the no mean and the yes standard deviation is less than the no standard deviation. The yes mean is less than the no mean and the yes standard deviation is more than the no standard deviation. The yes mean is more than the no mean and the yes standard deviation is less than the no standard deviation. > Moving to another question will save this response. > ENG 6:05 PM OLIO CO-ID R US 2022-01-25 D> Moving to another question will save this response. > Question 11 1 points Save Answer C3 Q5 V4: The survey data STATISTICSSTUDENTSSURVEYFORR contains the column WKHRSNEWS (a variable that measures the hours per week a student reads the news) and the column JTGOOD (a variable that answers yes or not to whether the student thinks Justin Trudeau is doing a good job. Use R to find the mean and standard deviation for the weekly hours per news for the yes students and the mean and standard deviation for the weekly hours for news for the no students. Choose the most correct answer below. The yes mean is more than the no mean and the yes standard deviation is more than the no standard deviation. The yes mean is less than the no mean and the yes standard deviation is less than the no standard deviation. The yes mean is less than the no mean and the yes standard deviation is more than the no standard deviation. The yes mean is more than the no mean and the yes standard deviation is less than the no standard deviation. > Moving to another question will save this response. > ENG 6:05 PM OLIO CO-ID R US 2022-01-25 DQuestion 12 1 points Save Answer C3 Q6 V3 The survey data STATISTICSSTUDENTSSURVEYFORR contains the column BEFBREATHMIN which is a variable that measures the number of breaths taken by students before completing a survey and the column BEFPULSEMIN which is a variable that measures the pulse beats per minute taken by students before completing a survey. Use R to make an appropriate graph to describe the data Indicate which of the following statements is most correct. The before-survey breaths per minute and the before-survey pulse beats per minute increase together for this data As the before-survey breaths per minute increase, the before-survey pulse beats per minute decrease As the before-survey pulse beats per minute increase, the before-survey breaths per minute decrease As the before-survey breaths per minute increase, the before-survey pulse beats per minute do not change. Click Submit to complete this assessment
Step by Step Solution
There are 3 Steps involved in it
Step: 1
Get Instant Access to Expert-Tailored Solutions
See step-by-step solutions with expert insights and AI powered tools for academic success
Step: 2
Step: 3
Ace Your Homework with AI
Get the answers you need in no time with our AI-driven, step-by-step assistance