

Answered step by step
Verified Expert Solution
Question
1 Approved Answer
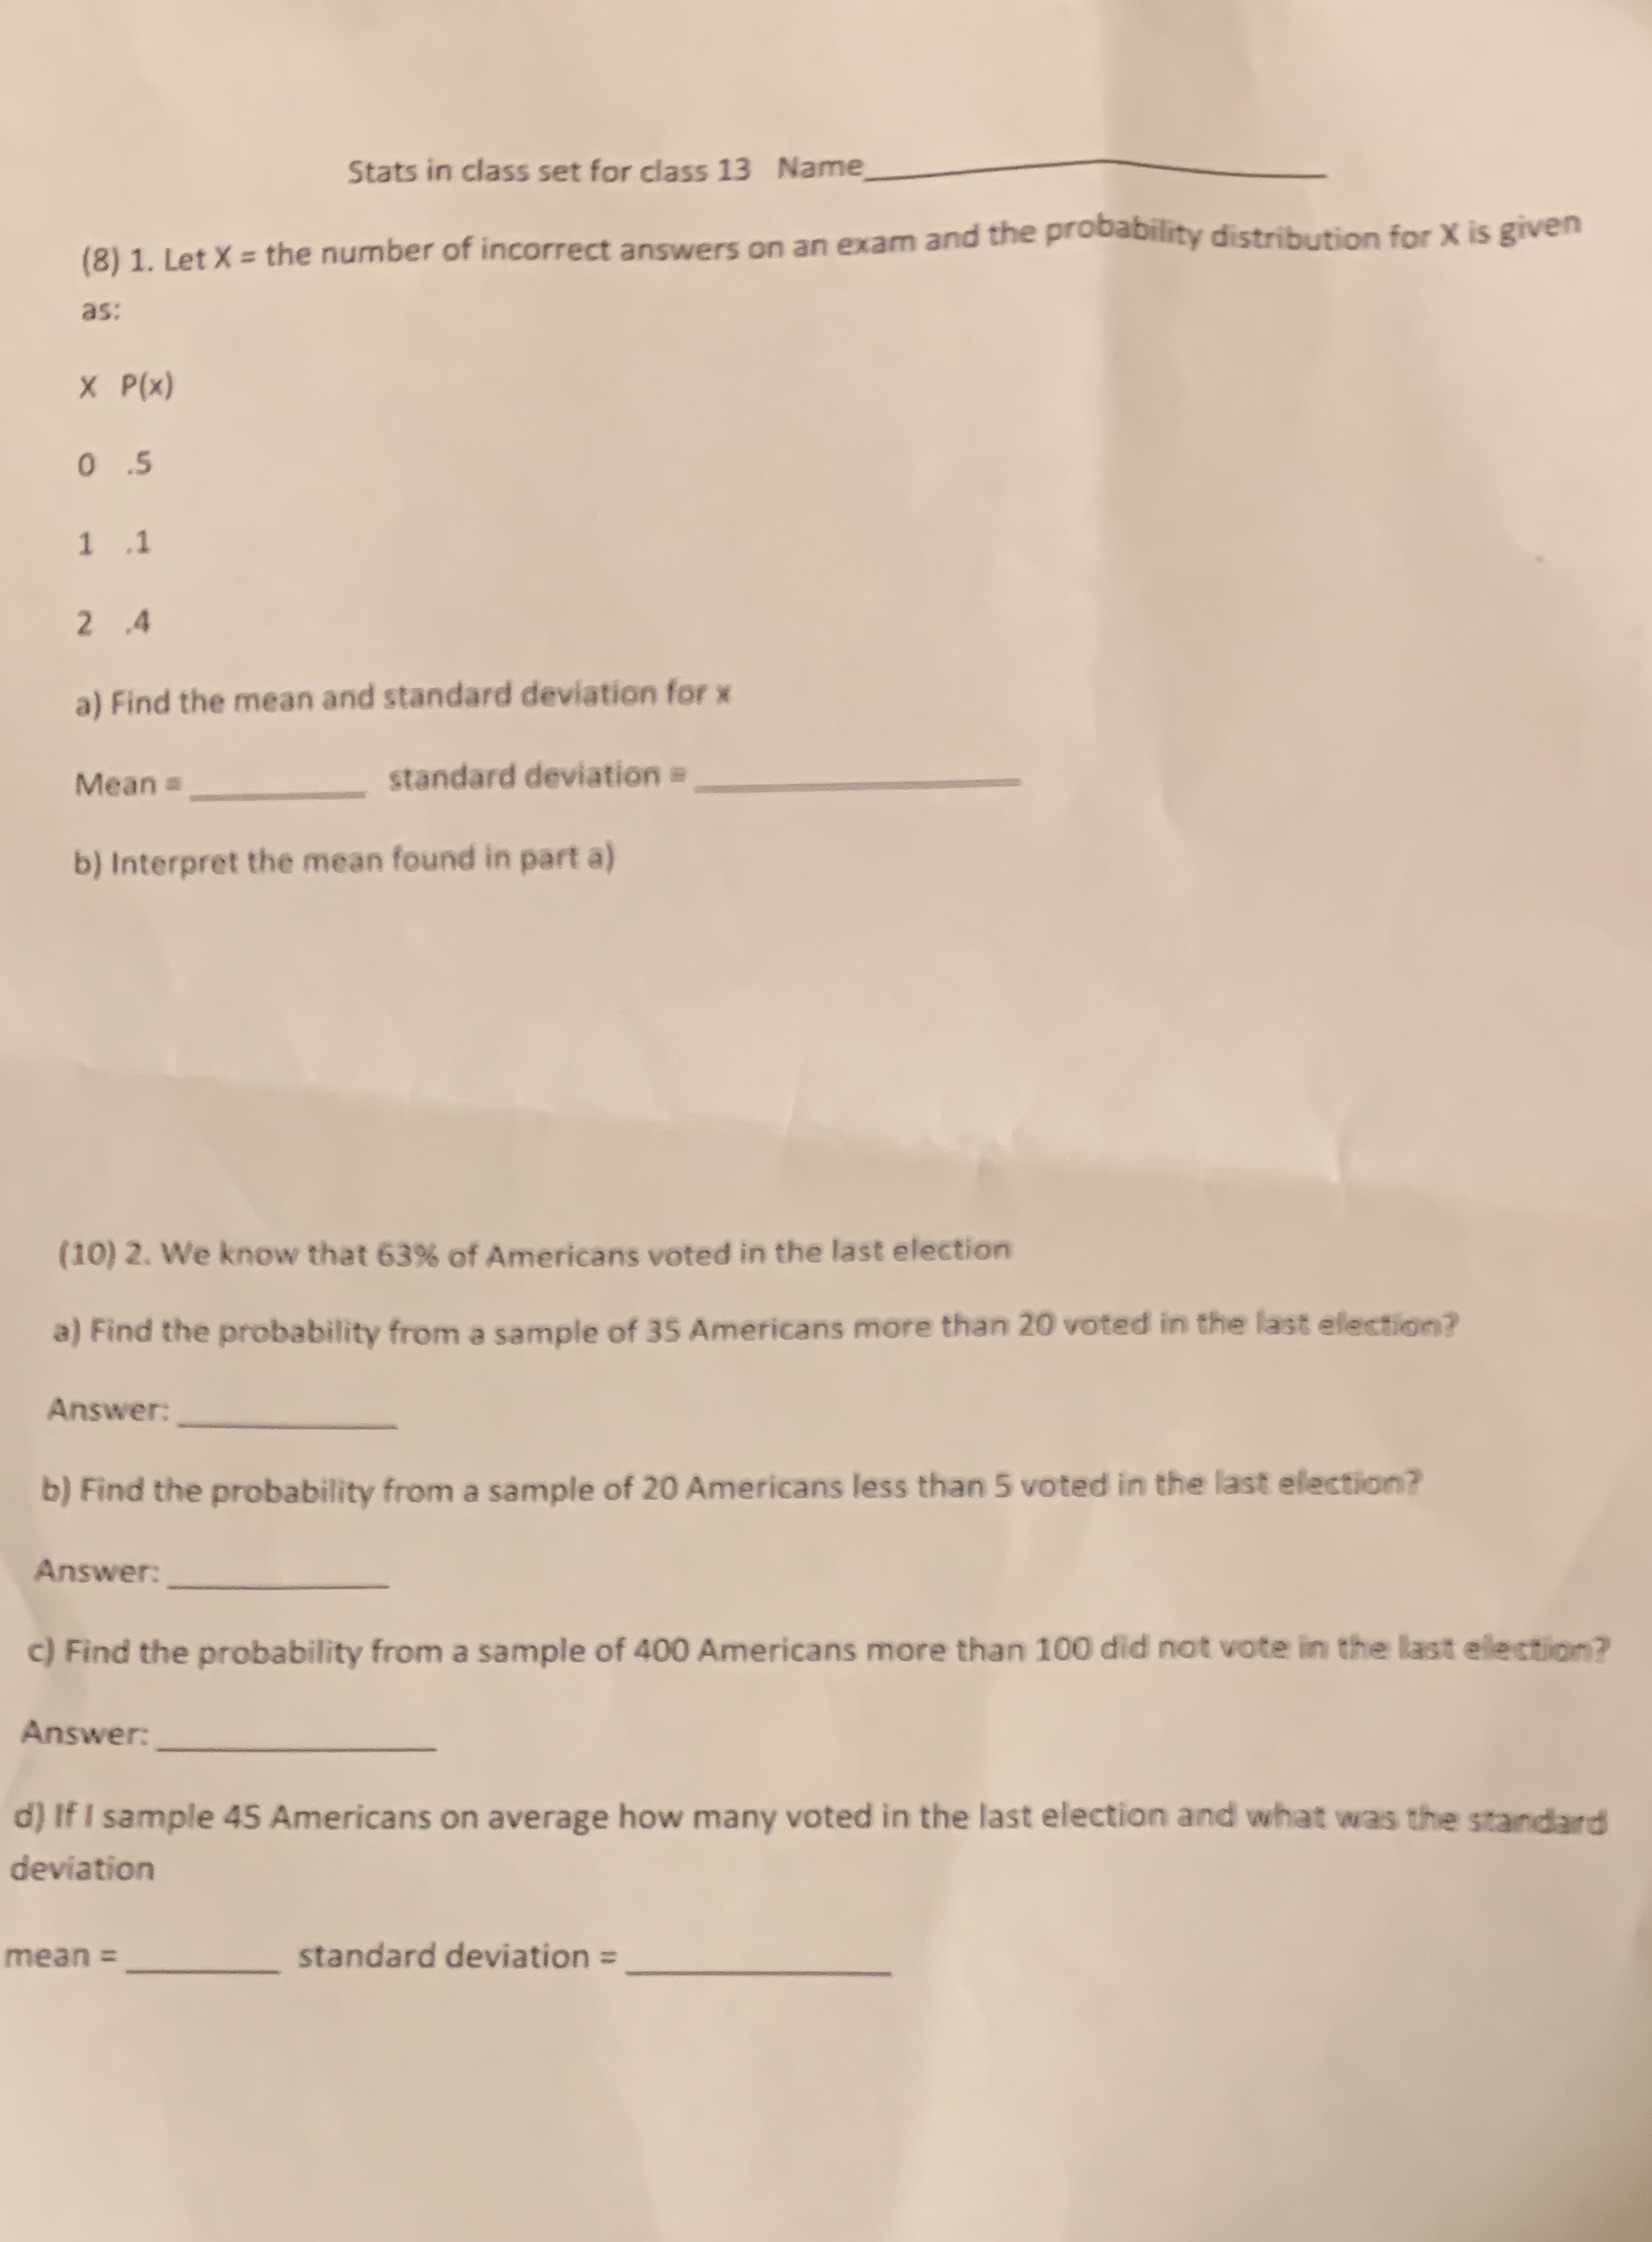
Stats in class set for class 13 Name (8) 1. Let X = the number of incorrect answers on an exam and the probability distribution
Step by Step Solution
There are 3 Steps involved in it
Step: 1

Get Instant Access to Expert-Tailored Solutions
See step-by-step solutions with expert insights and AI powered tools for academic success
Step: 2

Step: 3
Ace Your Homework with AI
Get the answers you need in no time with our AI-driven, step-by-step assistance
Get Started
Performance Analysis And Synthesis For Discrete-Time Stochastic Systems With Network-Enhanced Complexities
Authors: Derui Ding, Zidong Wang, Guoliang Wei
1st Edition
0429880022, 9780429880025