-
Step 1: Identify Suitable Analytical Procedures. Your audit senior has suggested that you should use the following ratios (on an overall financial statement level) for planning analytical procedures in the revenue cycle at PharmaCorp:
-
Turnover of receivables: (revenues/average accounts receivable); for ease of computation simply use ending accounts receivable
-
Receivables as a percentage of current assets and as a percentage of total assets: (accounts receivable/total current assets) and (accounts receivable/total assets)
-
Allowance for uncollectible accounts as a percentage of accounts receivable: (allowance/accounts receivable)
- Gross margin: (revenues-cost of sales)/revenues
- As part of Step 1, identify any other relevant relationships or trend analyses that would be useful to consider as part of planning analytics. Explain your reasoning.
-
Step 2: Evaluate Reliability of Data Used to Develop Expectations. The audit team has determined that the data you will be using to develop expectations in the revenue cycle are reliable. Indicate the factors that the audit team likely considered in making that determination.
-
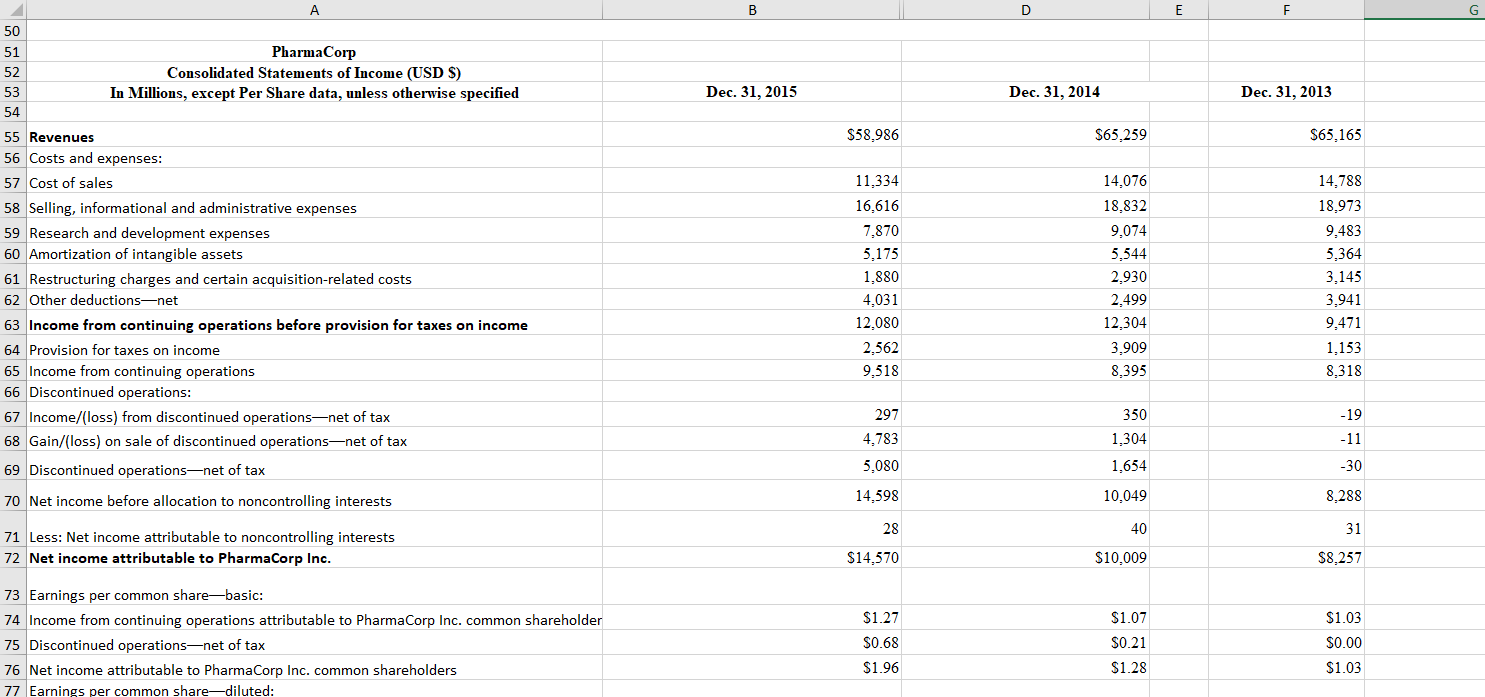
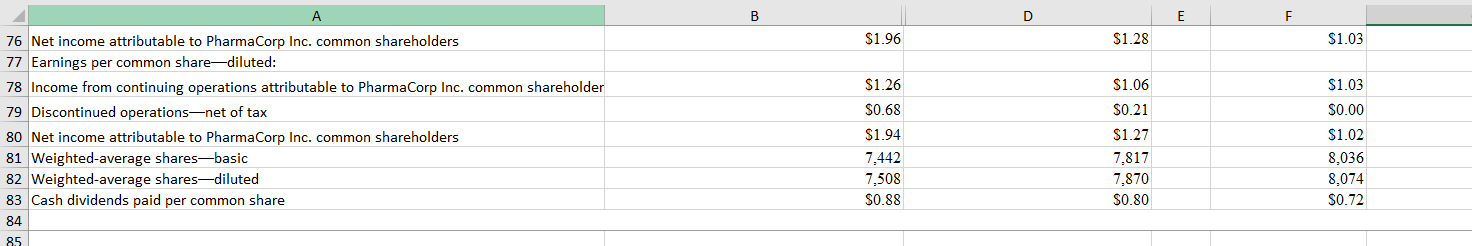
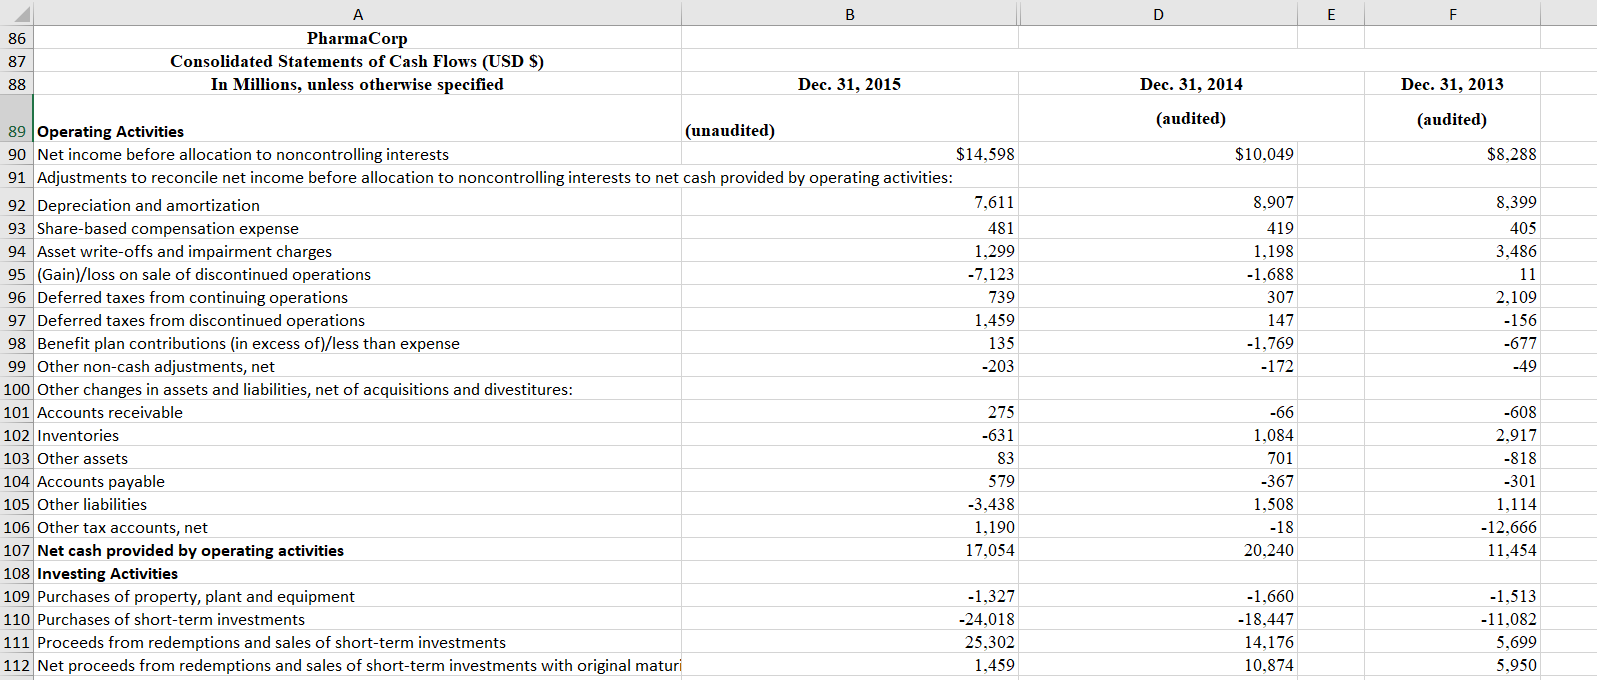
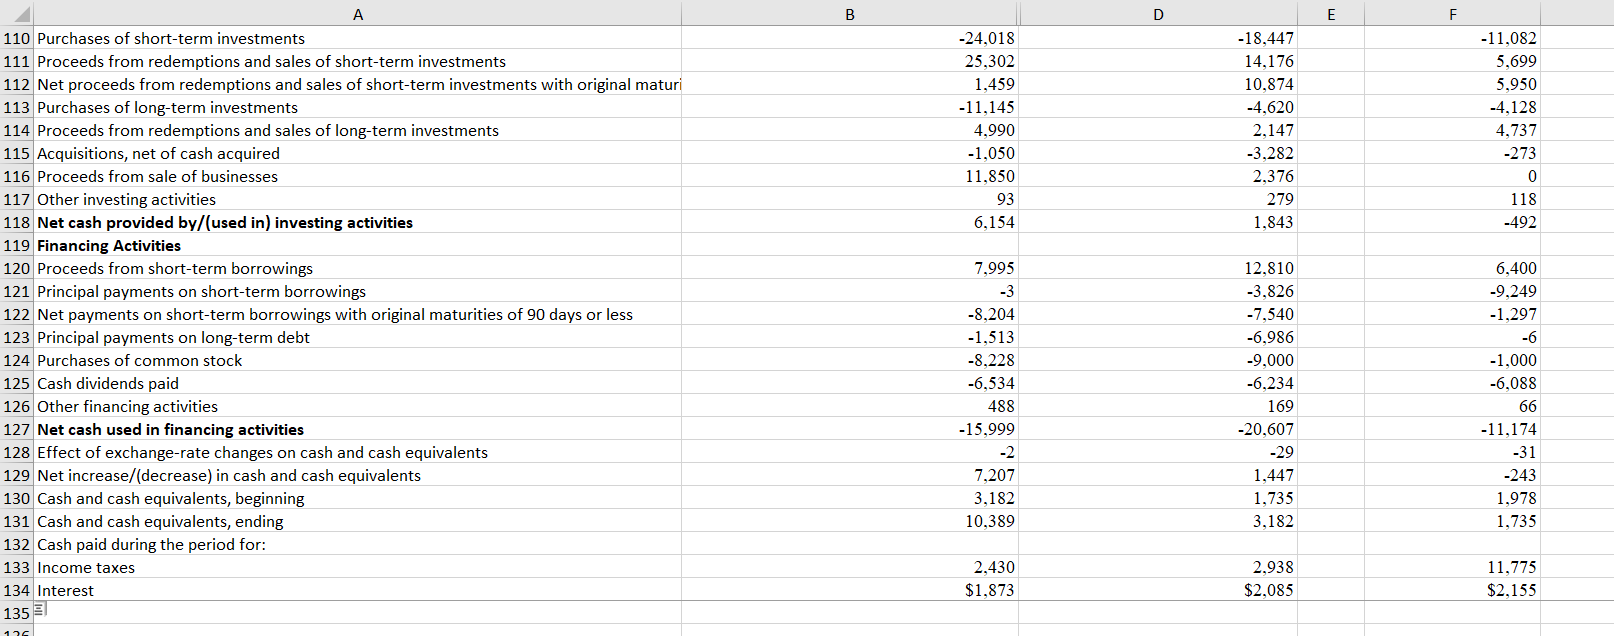
Step 3: Develop Expectations. Complete Step 3 of planning analytical procedures by developing expectations for relevant accounts in the revenue cycle and for the ratios from Part (a). Develop expectations by considering both historical trends of PharmaCorp, and also by considering features of and historical trends in the industry. Given that this is a planning analytical procedure, the expectations are not expected to have a high level of precision. You might indicate that you expect a ratio to increase, decrease, or stay the same, and possibly indicate the size of any expected increases or decreases, or the range of the expected ratio. PharmaCorps financial information is on first tab of the Excel file, while the financial information for Novartell and AstraZoro is provided on the last two tabs of the Excel file.
-
Step 4 and Step 5: Define and Identify Significant Unexpected Differences. Refer to the guidance in Chapter 7 on overall materiality, performance materiality, and posting materiality. Apply those materiality guidelines to Step 4 of planning analytical procedures in the revenue cycle for PharmaCorp, to define what is meant by a significant difference. Explain your reasoning. Also, comment on qualitative materiality considerations in this context. Now that you have determined what amount of difference would be considered significant, calculate the ratios identified in Step 1 (and any additional ratios or trend analyses that you suggested), based on PharmaCorps recorded financial statement amounts. Identify those ratios where there is a significant unexpected difference.
-
Step 6 and Step 7: Investigate Significant Unexpected Differences and Ensure Proper Documentation. Complete Step 6 of planning analytical procedures by describing accounts or relationships that you would investigate further through substantive audit procedures. Explain your reasoning. To complete Step 7, describe what information should be included in the auditors workpapers.
-
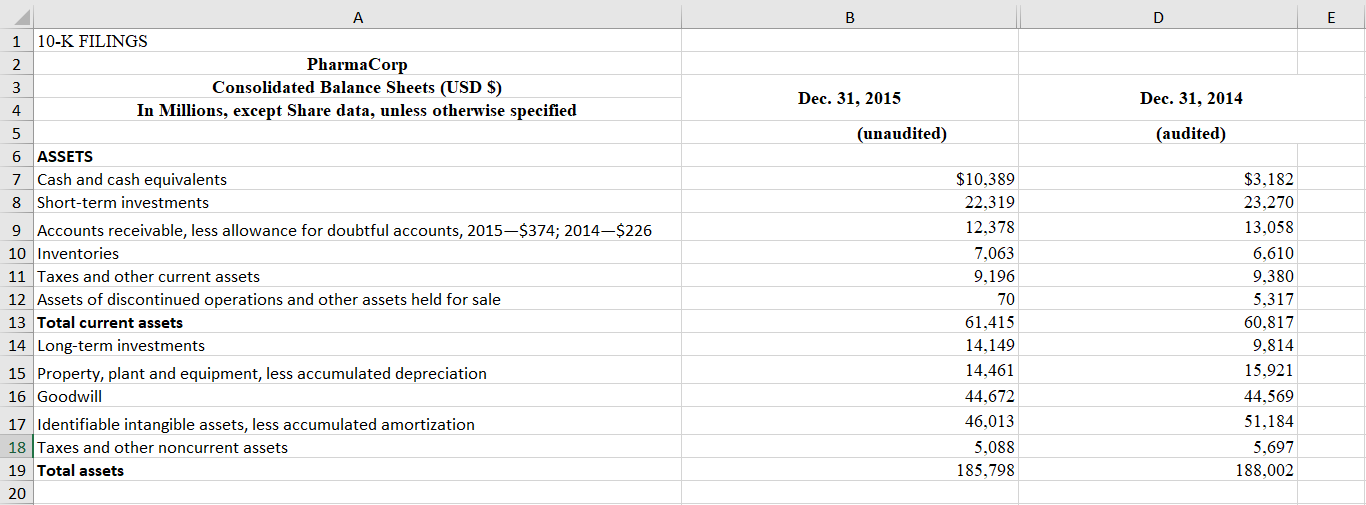
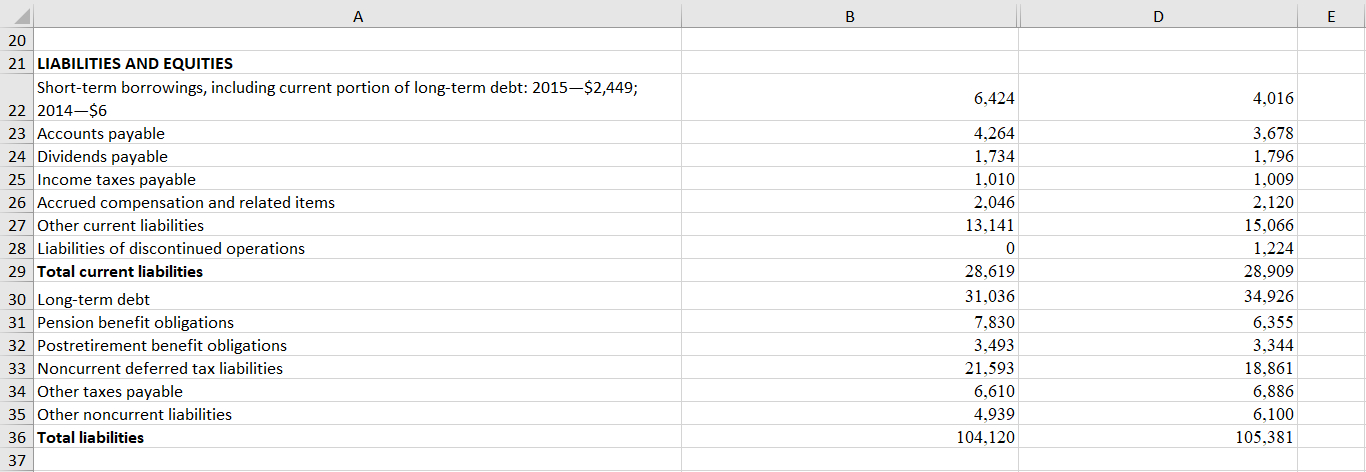
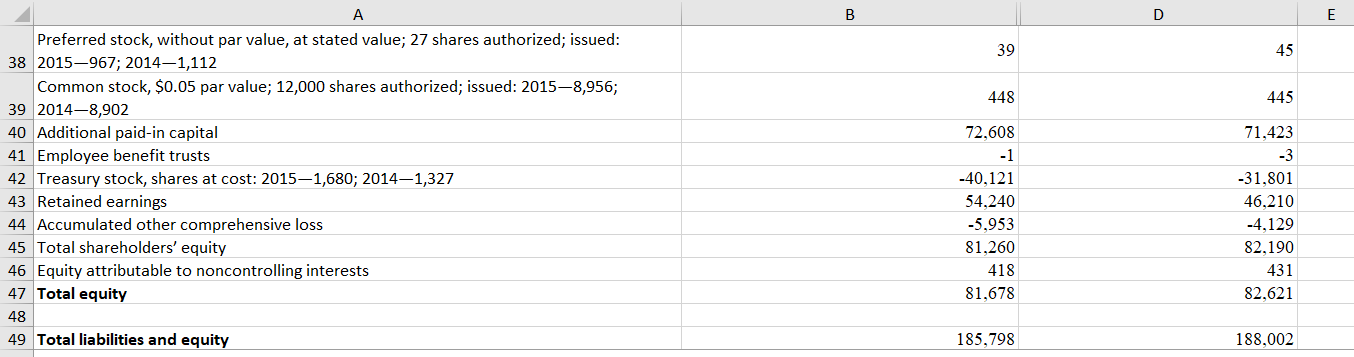
B D E Dec. 31, 2015 Dec. 31, 2014 (unaudited) (audited) A 1 10-K FILINGS 2 PharmaCorp 3 Consolidated Balance Sheets (USD $) 4 In Millions, except Share data, unless otherwise specified 5 6 ASSETS 7 Cash and cash equivalents 8 Short-term investments 9 Accounts receivable, less allowance for doubtful accounts, 2015-$374; 2014$226 10 Inventories 11 Taxes and other current assets 12 Assets of discontinued operations and other assets held for sale 13 Total current assets 14 Long-term investments 15 Property, plant and equipment, less accumulated depreciation 16 Goodwill 17 Identifiable intangible assets, less accumulated amortization 18 Taxes and other noncurrent assets 19 Total assets 20 $10,389 22,319 12,378 7,063 9.196 70 61,415 14,149 14,461 44.672 46,013 5,088 185,798 $3,182 23,270 13,058 6.610 9,380 5,317 60,817 9,814 15,921 44,569 51,184 5,697 188,002 B D E 6,424 4,016 A 20 21 LIABILITIES AND EQUITIES Short-term borrowings, including current portion of long-term debt: 2015$2,449; 22 2014-$6 23 Accounts payable 24 Dividends payable 25 Income taxes payable 26 Accrued compensation and related items 27 Other current liabilities 28 Liabilities of discontinued operations 29 Total current liabilities 30 Long-term debt 31 Pension benefit obligations 32 Postretirement benefit obligations 33 Noncurrent deferred tax liabilities 34 Other taxes payable 35 Other noncurrent liabilities 36 Total liabilities 37 4,264 1,734 1,010 2.046 13,141 0 28,619 31,036 7,830 3,493 21,593 6,610 4.939 104,120 3,678 1,796 1,009 2,120 15,066 1,224 28,909 34.926 6,355 3,344 18,861 6,886 6.100 105,381 B D E 39 45 448 445 A Preferred stock, without par value, at stated value; 27 shares authorized; issued: 38 2015-967; 2014-1,112 Common stock, $0.05 par value; 12,000 shares authorized; issued: 20158,956; 39 2014-8,902 40 Additional paid-in capital 41 Employee benefit trusts 42 Treasury stock, shares at cost: 20151,680; 20141,327 43 Retained earnings 44 Accumulated other comprehensive loss 45 Total shareholders' equity 46 Equity attributable to noncontrolling interests 47 Total equity 48 49 Total liabilities and equity 72,608 -1 -40,121 54,240 -5,953 81,260 418 81,678 71,423 -3 -31,801 46,210 -4,129 82.190 431 82,621 185,798 188,002 B D E G Dec. 31, 2015 Dec. 31, 2014 Dec. 31, 2013 $58.986 $65,259 $65.165 50 51 PharmaCorp 52 Consolidated Statements of Income (USD S) 53 In Millions, except Per Share data, unless otherwise specified 54 55 Revenues 56 Costs and expenses: 57 Cost of sales 58 Selling, informational and administrative expenses 59 Research and development expenses 60 Amortization of intangible assets 61 Restructuring charges and certain acquisition-related costs 62 Other deductions-net 63 Income from continuing operations before provision for taxes on income 64 Provision for taxes on income 65 Income from continuing operations 66 Discontinued operations: 67 Income/loss) from discontinued operations-net of tax 68 Gain/(loss) on sale of discontinued operationsnet of tax 69 Discontinued operations-net of tax 70 Net income before allocation to noncontrolling interests 11,334 16,616 7.870 5,175 1.880 4,031 12.080 2,562 9,518 14,076 18.832 9,074 5,544 2.930 2,499 12,304 3,909 8,395 14,788 18,973 9,483 5,364 3.145 3.941 9,471 1.153 8,318 297 4.783 350 1,304 -19 -11 5.080 1,654 -30 14,598 10,049 8,288 28 40 31 71 Less: Net income attributable to noncontrolling interests 72 Net income attributable to PharmaCorp Inc. $14,570 $10.009 $8,257 73 Earnings per common share-basic: 74 Income from continuing operations attributable to PharmaCorp Inc. common shareholder 75 Discontinued operations-net of tax 76 Net income attributable to PharmaCorp Inc. common shareholders 77 Earnings per common share-diluted: $1.27 $0.68 $1.07 $0.21 $1.03 $0.00 $1.03 $1.96 $1.28 B D E F $1.96 $1.28 $1.03 $1.06 $0.21 76 Net income attributable to PharmaCorp Inc. common shareholders 77 Earnings per common share-diluted: 78 Income from continuing operations attributable to PharmaCorp Inc. common shareholder 79 Discontinued operations-net of tax 80 Net income attributable to PharmaCorp Inc. common shareholders 81 Weighted average shares-basic 82 Weighted average shares-diluted 83 Cash dividends paid per common share 84 85 $1.26 $0.68 $1.94 7,442 7.508 $0.88 $1.27 7.817 7.870 $0.80 $1.03 $0.00 $1.02 8,036 8,074 S0.72 B D E F 86 87 88 A PharmaCorp Consolidated Statements of Cash Flows (USD $) In Millions, unless otherwise specified Dec. 31, 2015 Dec. 31, 2014 Dec. 31, 2013 (audited) (audited) $10,049 $8,288 8.907 419 1,198 -1.688 307 147 -1,769 -172 8,399 405 3,486 11 2,109 -156 -677 -49 89 Operating Activities (unaudited) 90 Net income before allocation to noncontrolling interests $14,598 91 Adjustments to reconcile net income before allocation to noncontrolling interests to net cash provided by operating activities: 92 Depreciation and amortization 7,611 93 Share-based compensation expense 481 94 Asset write-offs and impairment charges 1,299 95 (Gain)/loss on sale of discontinued operations -7,123 96 Deferred taxes from continuing operations 739 97 Deferred taxes from discontinued operations 1,459 98 Benefit plan contributions (in excess of)/less than expense 135 99 Other non-cash adjustments, net -203 100 Other changes in assets and liabilities, net of acquisitions and divestitures: 101 Accounts receivable 275 102 Inventories -631 103 Other assets 83 104 Accounts payable 579 105 Other liabilities -3,438 106 Other tax accounts, net 1,190 107 Net cash provided by operating activities 17,054 108 Investing Activities 109 Purchases of property, plant and equipment -1,327 110 Purchases of short-term investments -24.018 111 Proceeds from redemptions and sales of short-term investments 25,302 112 Net proceeds from redemptions and sales of short-term investments with original maturi 1,459 -66 1,084 701 -367 1,508 -18 20.240 -608 2,917 -818 -301 1,114 -12,666 11.454 -1,660 -18,447 14,176 10,874 -1,513 -11,082 5,699 5,950 A B D E F -24,018 25,302 1,459 -11,145 4,990 -1,050 11,850 93 6,154 -18,447 14,176 10,874 -4,620 2.147 -3,282 2,376 279 1.843 -11,082 5,699 5,950 -4,128 4.737 -273 0 118 -492 110 Purchases of short-term investments 111 Proceeds from redemptions and sales of short-term investments 112 Net proceeds from redemptions and sales of short-term investments with original maturi 113 Purchases of long-term investments 114 Proceeds from redemptions and sales of long-term investments 115 Acquisitions, net of cash acquired 116 Proceeds from sale of businesses 117 Other investing activities 118 Net cash provided by/(used in) investing activities 119 Financing Activities 120 Proceeds from short-term borrowings 121 Principal payments on short-term borrowings 122 Net payments on short-term borrowings with original maturities of 90 days or less 123 Principal payments on long-term debt 124 Purchases of common stock 125 Cash dividends paid 126 Other financing activities 127 Net cash used in financing activities 128 Effect of exchange rate changes on cash and cash equivalents 129 Net increase/(decrease) in cash and cash equivalents 130 Cash and cash equivalents, beginning 131 Cash and cash equivalents, ending 132 Cash paid during the period for: 133 Income taxes 134 Interest 135 7.995 -3 -8.204 -1,513 -8,228 -6,534 488 -15,999 -2 7.207 3,182 10,389 12,810 -3,826 -7,540 -6.986 -9,000 -6,234 169 -20,607 -29 1,447 1,735 3,182 6,400 -9,249 -1,297 -6 -1,000 -6,088 66 -11,174 -31 -243 1,978 1,735 2,430 $1,873 2.938 $2,085 11,775 $2,155 126