

Question
STEP 1 import numpy as np import pandas as pd import scipy.stats as st import matplotlib.pyplot as plt from IPython.display import display, HTML # dataframe
STEP 1
import numpy as np
import pandas as pd
import scipy.stats as st
import matplotlib.pyplot as plt
from IPython.display import display, HTML
# dataframe for this project
nba_wins_df = pd.read_csv('nba_wins_data.csv')
display(HTML(nba_wins_df.head().to_html()))
print("printed only the first five observations...")
print("Number of rows in the dataset =", len(nba_wins_df))
year_idfran_idavg_ptsavg_opp_pts avg_elo_n avg_opp_elo_navg_pts_differential avg_elo_differential total_wins
0 1995 Bucks 99.341463 103.707317 1368.604789 1497.311587 -4.365854 -128.706798 34
1 1995 Bulls 101.524390 96.695122 1569.892129 1488.199352 4.829268 81.692777 47
2 1995 Cavaliers 90.451220 89.829268 1542.433391 1498.848261 0.621951 43.585130 43
3 1995 Celtics 102.780488 104.658537 1431.307532 1495.936224 -1.878049 -64.628693 35
4 1995 Clippers 96.670732 105.829268 1309.053701 1517.260260 -9.158537 -208.206558 17
printed only the first five observations...
Number of rows in the dataset = 618
Step 2
import scipy.stats as st
# ---- TODO: make your edits here ----
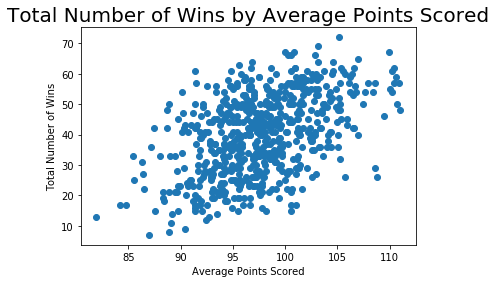
plt.plot(nba_wins_df['avg_pts'], nba_wins_df['total_wins'], 'o')
plt.title('Total Number of Wins by Average Points Scored', fontsize=20)
plt.xlabel('Average Points Scored')
plt.ylabel('Total Number of Wins')
plt.show()
# ---- TODO: make your edits here ----
correlation_coefficient, p_value = st.pearsonr(nba_wins_df['avg_pts'], nba_wins_df['total_wins'])
print("Correlation between Average Points Scored and the Total Number of Wins ")
print("Pearson Correlation Coefficient =", round(correlation_coefficient,4))
print("P-value =", round(p_value,4))

Step by Step Solution
There are 3 Steps involved in it
Step: 1

Get Instant Access to Expert-Tailored Solutions
See step-by-step solutions with expert insights and AI powered tools for academic success
Step: 2

Step: 3
Ace Your Homework with AI
Get the answers you need in no time with our AI-driven, step-by-step assistance
Get Started
Algebra And Trigonometry Enhanced With Graphing Utilities
Authors: Michael Sullivan, Michael Sullivan III
7th Edition
0134269039, 9780134269030