

Answered step by step
Verified Expert Solution
Question
1 Approved Answer
Step 2) Build a table of correlations similar to the table below for the correlations among ALL of the INDIVIDUAL assets and the S&P 500
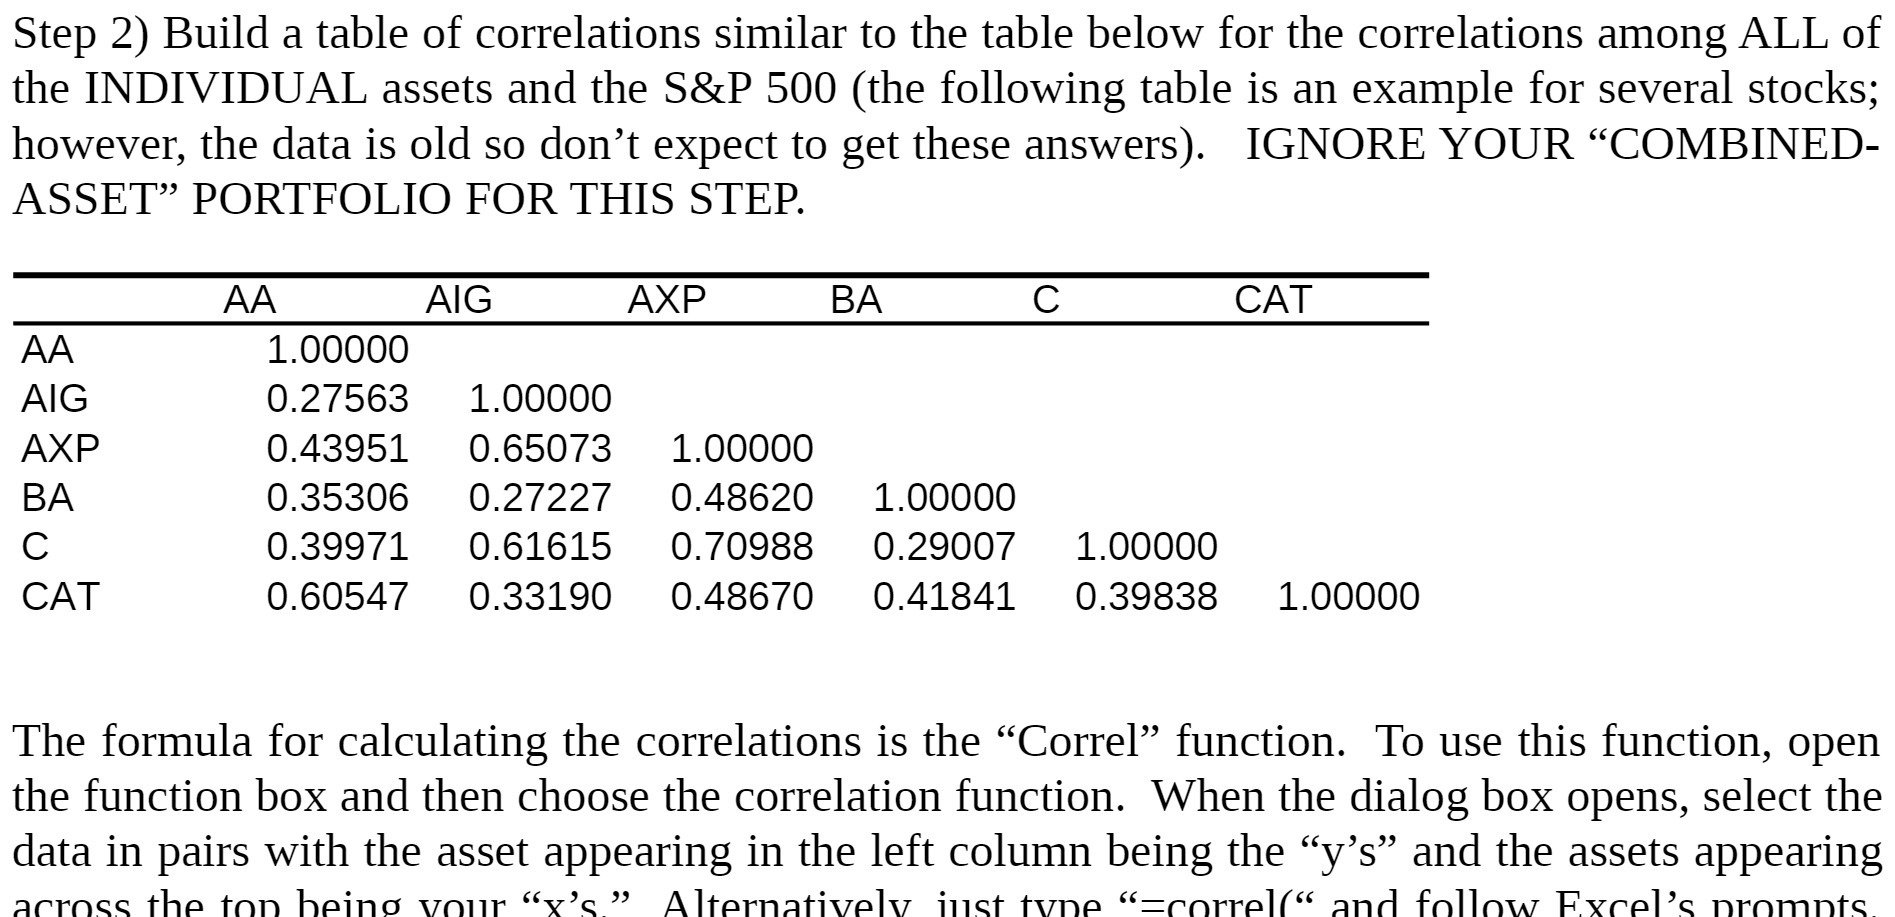 Step 2) Build a table of correlations similar to the table below for the correlations among ALL of the INDIVIDUAL assets and the S&P 500 (the following table is an example for several stocks; however, the data is old so don't expect to get these answers). IGNORE YOUR "COMBINED- ASSET" PORTFOLIO FOR THIS STEP. AA AIG AXP BA C CAT AA 1.00000 AIG 0.27563 1.00000 AXP 0.43951 0.65073 1.00000 BA 0.35306 0.27227 0.48620 1.00000 C 0.39971 0.61615 0.70988 0.29007 1.00000 CAT 0.60547 0.33190 0.48670 0.41841 0.39838 1.00000 The formula for calculating the correlations is the "Correl" function. To use this function, open the function box and then choose the correlation function. When the dialog box opens, select the data in pairs with the asset appearing in the left column being the "y's" and the assets appearing across the top being your "y's " Alternatively just type "= correl(" and follow Excel's prompts
Step by Step Solution
There are 3 Steps involved in it
Step: 1

Get Instant Access to Expert-Tailored Solutions
See step-by-step solutions with expert insights and AI powered tools for academic success
Step: 2

Step: 3
Ace Your Homework with AI
Get the answers you need in no time with our AI-driven, step-by-step assistance
Get Started
Macroeconomics Principles Applications And Tools
Authors: Arthur O Sullivan, Steven M. Sheffrin, Stephen J. Perez
7th Edition
ISBN: 978-0134089034, 9780134062754, 134089030, 134062752, 978-0132555234