Answered step by step
Verified Expert Solution
Question
1 Approved Answer
Step 3: Calculation of the Size-Adjusted Cumulative Abnormal Returns The measurement of stock returns begins four months after the end of the fiscal year
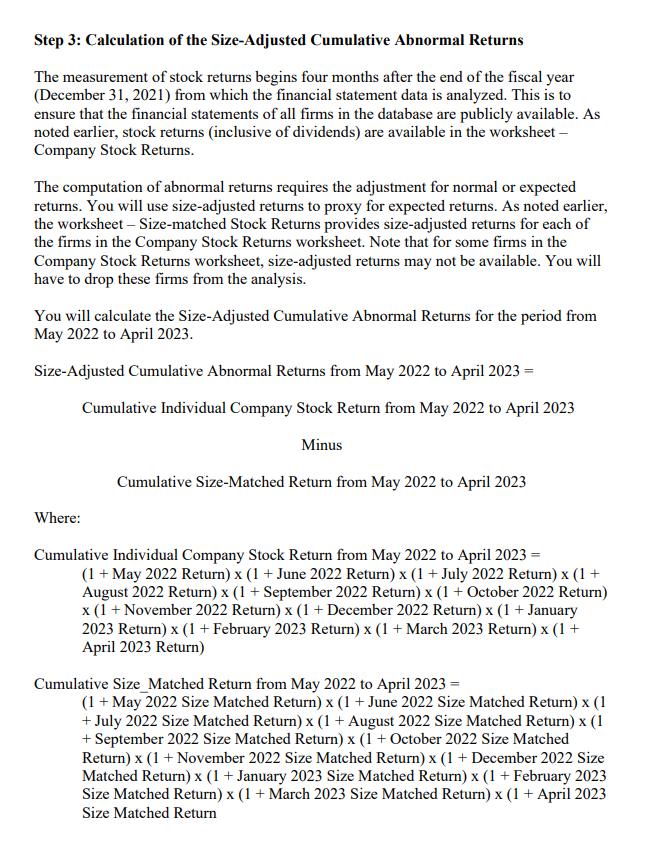
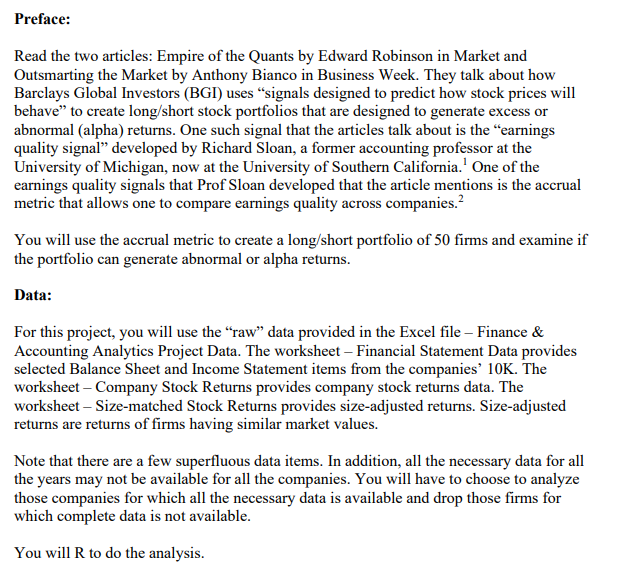
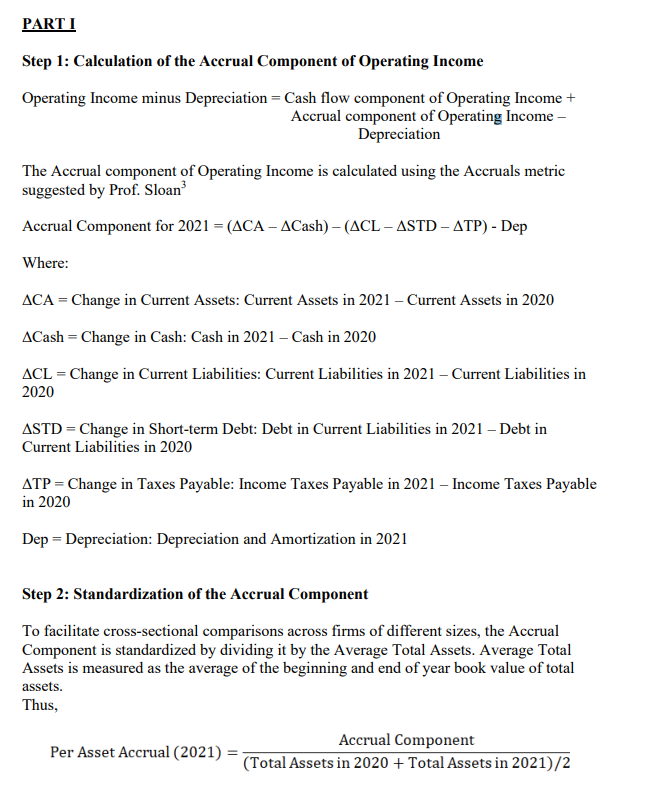
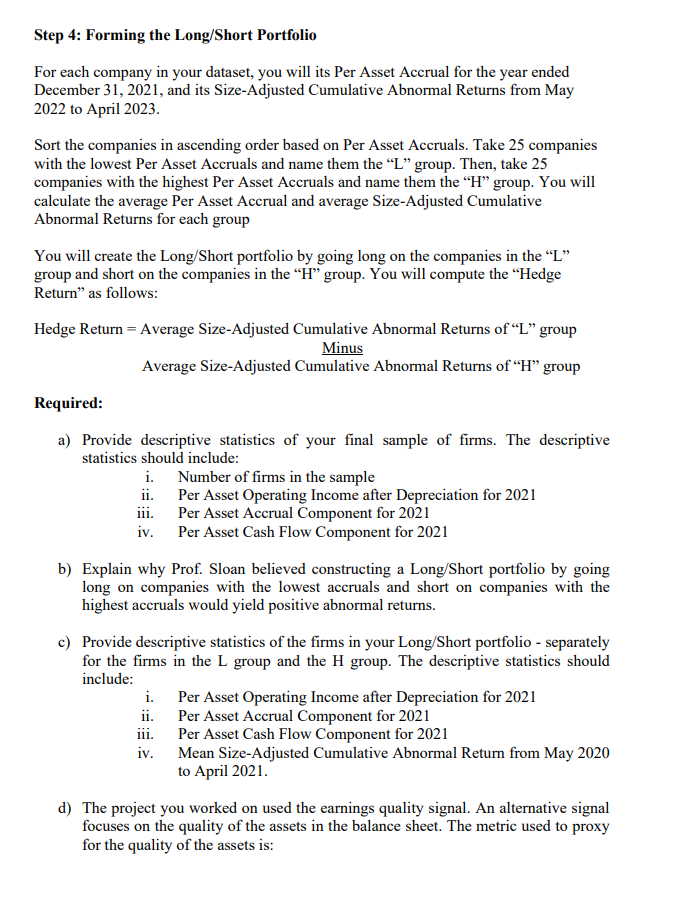
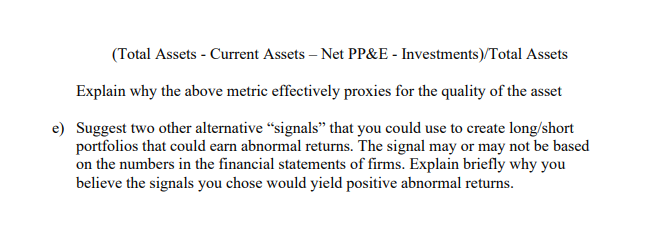
Step 3: Calculation of the Size-Adjusted Cumulative Abnormal Returns The measurement of stock returns begins four months after the end of the fiscal year (December 31, 2021) from which the financial statement data is analyzed. This is to ensure that the financial statements of all firms in the database are publicly available. As noted earlier, stock returns (inclusive of dividends) are available in the worksheet - Company Stock Returns. The computation of abnormal returns requires the adjustment for normal or expected returns. You will use size-adjusted returns to proxy for expected returns. As noted earlier, the worksheet-Size-matched Stock Returns provides size-adjusted returns for each of the firms in the Company Stock Returns worksheet. Note that for some firms in the Company Stock Returns worksheet, size-adjusted returns may not be available. You will have to drop these firms from the analysis. You will calculate the Size-Adjusted Cumulative Abnormal Returns for the period from May 2022 to April 2023. Size-Adjusted Cumulative Abnormal Returns from May 2022 to April 2023 = Where: Cumulative Individual Company Stock Return from May 2022 to April 2023 Minus Cumulative Size-Matched Return from May 2022 to April 2023 Cumulative Individual Company Stock Return from May 2022 to April 2023 = (1 + May 2022 Return) x (1 + June 2022 Return) x (1 + July 2022 Return) x (1 + August 2022 Return) x (1 + September 2022 Return) x (1 + October 2022 Return) x (1+ November 2022 Return) x (1 + December 2022 Return) x (1 + January 2023 Return) x (1 + February 2023 Return) x (1 + March 2023 Return) x (1 + April 2023 Return) Cumulative Size_Matched Return from May 2022 to April 2023 = (1 + May 2022 Size Matched Return) x (1 + June 2022 Size Matched Return) x (1 + July 2022 Size Matched Return) x (1 + August 2022 Size Matched Return) x (1 + September 2022 Size Matched Return) x (1+ October 2022 Size Matched Return) x (1+November 2022 Size Matched Return) x (1 + December 2022 Size Matched Return) x (1+ January 2023 Size Matched Return) x (1 + February 2023 Size Matched Return) x (1 + March 2023 Size Matched Return) x (1 + April 2023 Size Matched Return Preface: Read the two articles: Empire of the Quants by Edward Robinson in Market and Outsmarting the Market by Anthony Bianco in Business Week. They talk about how Barclays Global Investors (BGI) uses "signals designed to predict how stock prices will behave" to create long/short stock portfolios that are designed to generate excess or abnormal (alpha) returns. One such signal that the articles talk about is the "earnings quality signal" developed by Richard Sloan, a former accounting professor at the University of Michigan, now at the University of Southern California. One of the earnings quality signals that Prof Sloan developed that the article mentions is the accrual metric that allows one to compare earnings quality across companies. You will use the accrual metric to create a long/short portfolio of 50 firms and examine if the portfolio can generate abnormal or alpha returns. Data: For this project, you will use the "raw" data provided in the Excel file - Finance & Accounting Analytics Project Data. The worksheet - Financial Statement Data provides selected Balance Sheet and Income Statement items from the companies' 10K. The worksheet - Company Stock Returns provides company stock returns data. The worksheet-Size-matched Stock Returns provides size-adjusted returns. Size-adjusted returns are returns of firms having similar market values. Note that there are a few superfluous data items. In addition, all the necessary data for all the years may not be available for all the companies. You will have to choose to analyze those companies for which all the necessary data is available and drop those firms for which complete data is not available. You will R to do the analysis. PART I Step 1: Calculation of the Accrual Component of Operating Income Operating Income minus Depreciation = Cash flow component of Operating Income + Accrual component of Operating Income - Depreciation The Accrual component of Operating Income is calculated using the Accruals metric suggested by Prof. Sloan Accrual Component for 2021 = (ACA - ACash) - (ACL - ASTD-ATP) - Dep Where: ACA = Change in Current Assets: Current Assets in 2021 - Current Assets in 2020 ACash = Change in Cash: Cash in 2021 - Cash in 2020 ACL = Change in Current Liabilities: Current Liabilities in 2021 - Current Liabilities in 2020 ASTD = Change in Short-term Debt: Debt in Current Liabilities in 2021 - Debt in Current Liabilities in 2020 ATP = Change in Taxes Payable: Income Taxes Payable in 2021 - Income Taxes Payable in 2020 Dep = Depreciation: Depreciation and Amortization in 2021 Step 2: Standardization of the Accrual Component To facilitate cross-sectional comparisons across firms of different sizes, the Accrual Component is standardized by dividing it by the Average Total Assets. Average Total Assets is measured as the average of the beginning and end of year book value of total assets. Thus, Accrual Component = (Total Assets in 2020 + Total Assets in 2021)/2 Per Asset Accrual (2021) = Step 4: Forming the Long/Short Portfolio For each company in your dataset, you will its Per Asset Accrual for the year ended December 31, 2021, and its Size-Adjusted Cumulative Abnormal Returns from May 2022 to April 2023. Sort the companies in ascending order based on Per Asset Accruals. Take 25 companies with the lowest Per Asset Accruals and name them the "L" group. Then, take 25 companies with the highest Per Asset Accruals and name them the "H" group. You will calculate the average Per Asset Accrual and average Size-Adjusted Cumulative Abnormal Returns for each group You will create the Long/Short portfolio by going long on the companies in the "L" group and short on the companies in the H group. You will compute the "Hedge Return" as follows: Hedge Return = Average Size-Adjusted Cumulative Abnormal Returns of "L" group Minus Required: Average Size-Adjusted Cumulative Abnormal Returns of "H" group a) Provide descriptive statistics of your final sample of firms. The descriptive statistics should include: i. ii. iii. iv. Number of firms in the sample Per Asset Operating Income after Depreciation for 2021 Per Asset Accrual Component for 2021 Per Asset Cash Flow Component for 2021 b) Explain why Prof. Sloan believed constructing a Long/Short portfolio by going long on companies with the lowest accruals and short on companies with the highest accruals would yield positive abnormal returns. c) Provide descriptive statistics of the firms in your Long/Short portfolio - separately for the firms in the L group and the H group. The descriptive statistics should include: i. Per Asset Operating Income after Depreciation for 2021 ii. Per Asset Accrual Component for 2021 iii. Per Asset Cash Flow Component for 2021 iv. Mean Size-Adjusted Cumulative Abnormal Return from May 2020 to April 2021. d) The project you worked on used the earnings quality signal. An alternative signal focuses on the quality of the assets in the balance sheet. The metric used to proxy for the quality of the assets is: (Total Assets - Current Assets - Net PP&E - Investments)/Total Assets Explain why the above metric effectively proxies for the quality of the asset e) Suggest two other alternative "signals" that you could use to create long/short portfolios that could earn abnormal returns. The signal may or may not be based on the numbers in the financial statements of firms. Explain briefly why you believe the signals you chose would yield positive abnormal returns.
Step by Step Solution
There are 3 Steps involved in it
Step: 1
Here are the steps I ...
Get Instant Access to Expert-Tailored Solutions
See step-by-step solutions with expert insights and AI powered tools for academic success
Step: 2

Step: 3

Ace Your Homework with AI
Get the answers you need in no time with our AI-driven, step-by-step assistance
Get Started


