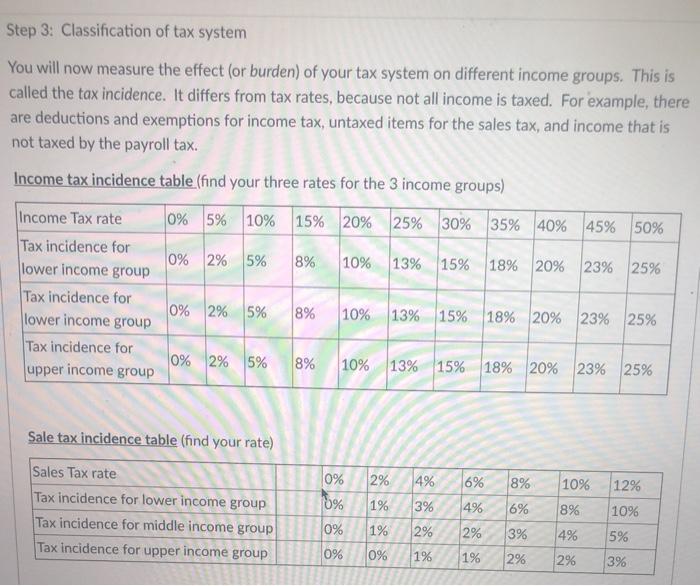
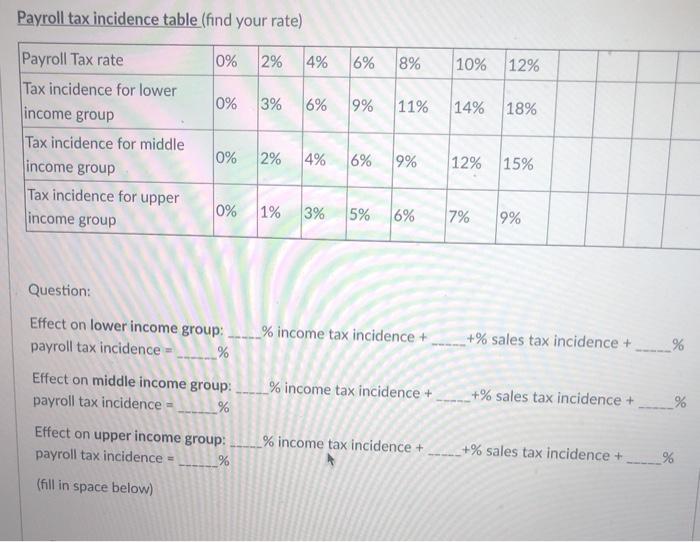
Step 3: Classification of tax system You will now measure the effect (or burden) of your tax system on different income groups. This is called the tax incidence. It differs from tax rates, because not all income is taxed. For example, there are deductions and exemptions for income tax, untaxed items for the sales tax, and income that is not taxed by the payroll tax. Income tax incidence table (find your three rates for the 3 income groups) Income Tax rate 0% 5% 10% 15% 20% 25% 30% 35% 40% 45% 50% Tax incidence for 0% 2% 5% 8% 10% 13% 15% 18% 20% 23% 25% lower income group Tax incidence for 0% 2% 5% 8% 10% 13% 15% 18% 20% 23% 25% lower income group Tax incidence for 0% 2% 5% 8% 10% 13% 15% 18% 20% 23% 25% upper income group 2% 4% 6% 8% Sale tax incidence table (find your rate) Sales Tax rate Tax incidence for lower income group Tax incidence for middle income group Tax incidence for upper income group 0% 0% 10% 12% 1% 3% 4% 6% 8% 10% 0% 1% 2% 3% 4% 2% 1% 5% 0% 0% 1% 2% 2% 3% Payroll tax incidence table (find your rate) 0% 2% 4% 6% 8% 10% 12% 0% 3% 6% 9% 11% 14% 18% Payroll Tax rate Tax incidence for lower income group Tax incidence for middle income group Tax incidence for upper income group 0% 2% 4% 6% 9% 12% 15% 0% 1% 3% 5% 6% 7% 9% Question: [+% sales tax incidence + % Effect on lower income group: _____% income tax incidence + payroll tax incidence % Effect on middle income group: _% income tax incidence + payroll tax incidence = % +% sales tax incidence + % Effect on upper income group: payroll tax incidence = % % income tax incidence + +% sales tax incidence + % (fill in space below) To improve the tax incidence, you may go back to Step 1 and adjust your income, sale, and payroll tax rates so that your are satisfied with the effect on each income group. Once you have made final adjustments, classify your tax system. Is you overall system progressive, regressive, or proportional? Explain briefly. How can you justify this system? Step 3: Classification of tax system You will now measure the effect (or burden) of your tax system on different income groups. This is called the tax incidence. It differs from tax rates, because not all income is taxed. For example, there are deductions and exemptions for income tax, untaxed items for the sales tax, and income that is not taxed by the payroll tax. Income tax incidence table (find your three rates for the 3 income groups) Income Tax rate 0% 5% 10% 15% 20% 25% 30% 35% 40% 45% 50% Tax incidence for 0% 2% 5% 8% 10% 13% 15% 18% 20% 23% 25% lower income group Tax incidence for 0% 2% 5% 8% 10% 13% 15% 18% 20% 23% 25% lower income group Tax incidence for 0% 2% 5% 8% 10% 13% 15% 18% 20% 23% 25% upper income group 2% 4% 6% 8% Sale tax incidence table (find your rate) Sales Tax rate Tax incidence for lower income group Tax incidence for middle income group Tax incidence for upper income group 0% 0% 10% 12% 1% 3% 4% 6% 8% 10% 0% 1% 2% 3% 4% 2% 1% 5% 0% 0% 1% 2% 2% 3% Payroll tax incidence table (find your rate) 0% 2% 4% 6% 8% 10% 12% 0% 3% 6% 9% 11% 14% 18% Payroll Tax rate Tax incidence for lower income group Tax incidence for middle income group Tax incidence for upper income group 0% 2% 4% 6% 9% 12% 15% 0% 1% 3% 5% 6% 7% 9% Question: [+% sales tax incidence + % Effect on lower income group: _____% income tax incidence + payroll tax incidence % Effect on middle income group: _% income tax incidence + payroll tax incidence = % +% sales tax incidence + % Effect on upper income group: payroll tax incidence = % % income tax incidence + +% sales tax incidence + % (fill in space below) To improve the tax incidence, you may go back to Step 1 and adjust your income, sale, and payroll tax rates so that your are satisfied with the effect on each income group. Once you have made final adjustments, classify your tax system. Is you overall system progressive, regressive, or proportional? Explain briefly. How can you justify this system


