Answered step by step
Verified Expert Solution
Question
1 Approved Answer
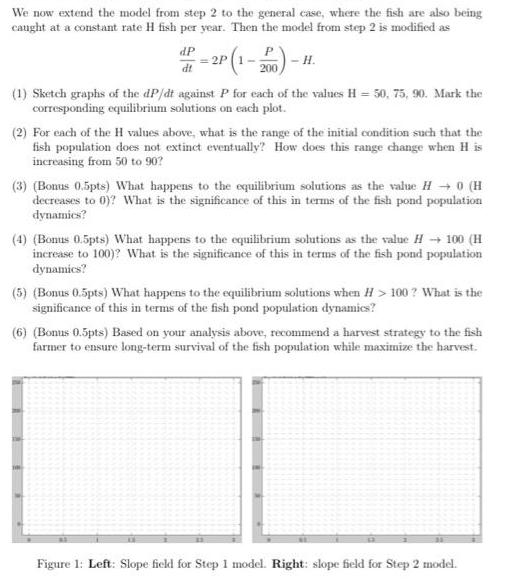
We now extend the model from step 2 to the general case, where the fish are also being caught at a constant rate H

We now extend the model from step 2 to the general case, where the fish are also being caught at a constant rate H fish per year. Then the model from step 2 is modified as dP = 2P . 200 (1) Sketch graphs of the dP/dt against P for each of the values H = 50, 75, 90. Mark the corresponding equilibrium solutions on each plot. (2) For each of the H values above, what is the range of the initial condition such that the fish population does not extinct eventually? How does this range change when H is increasing from 50 to 90? (3) (Bonus 0,5pts) What happens to the equilibrium solutions as the value H + 0 (H decreases to 0)? What is the significance of this in terms of the fish pond population dynamies? (4) (Bonus 0.5pts) What happens to the equilibrium solutions as the value H 100 (H increase to 100)? What is the significance of this in terms of the fish pond population dynamics? (5) (Bonus 0.5pts) What happens to the equilibrium solutions when H > 100 ? What is the significance of this in terms of the fish pond population dynamics? (6) (Bonus 0.5pts) Based on your analysis above, recommend a harvest strategy to the fish farmer to ensure long-term survival of the fish population while maximize the harvest. Figure 1: Left: Slope fiekl for Step 1 model. Right: slope field for Step 2 model.
Step by Step Solution
★★★★★
3.50 Rating (157 Votes )
There are 3 Steps involved in it
Step: 1
Answer Explanation Solution fis...
Get Instant Access to Expert-Tailored Solutions
See step-by-step solutions with expert insights and AI powered tools for academic success
Step: 2

Step: 3

Ace Your Homework with AI
Get the answers you need in no time with our AI-driven, step-by-step assistance
Get Started


