

Question
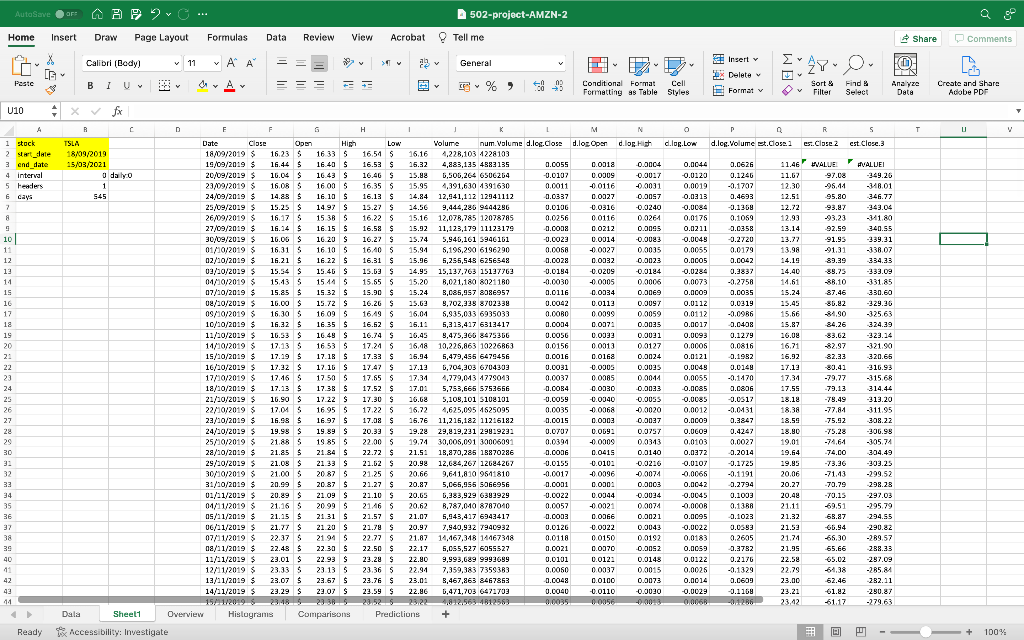
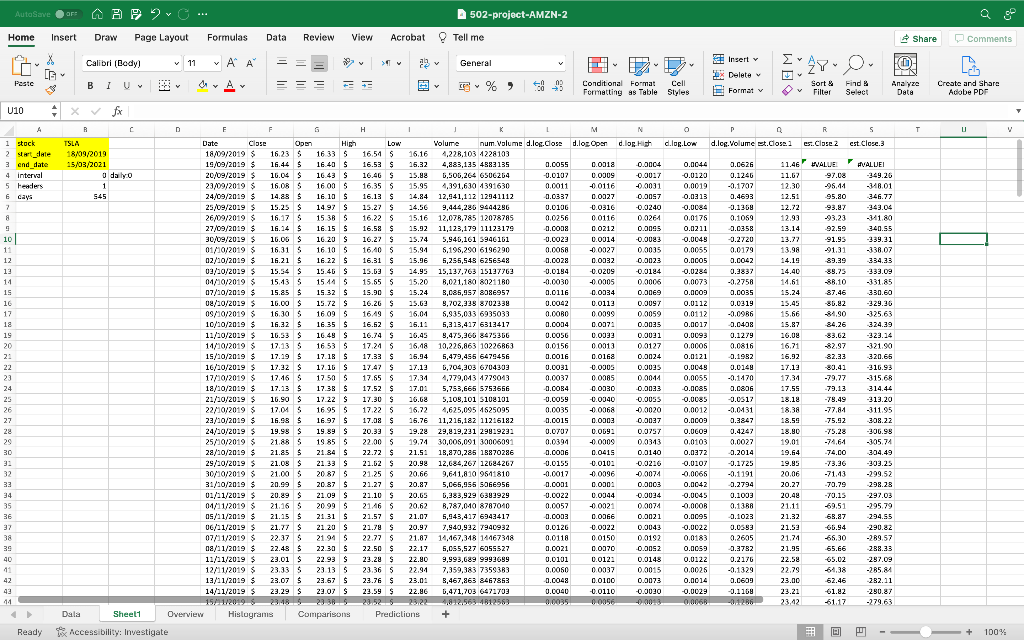
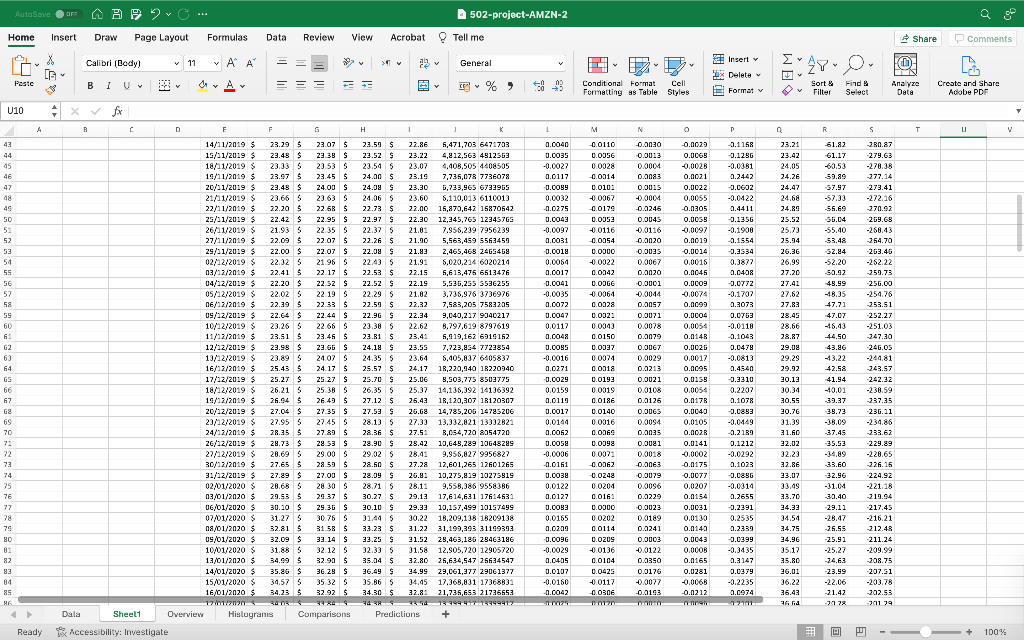
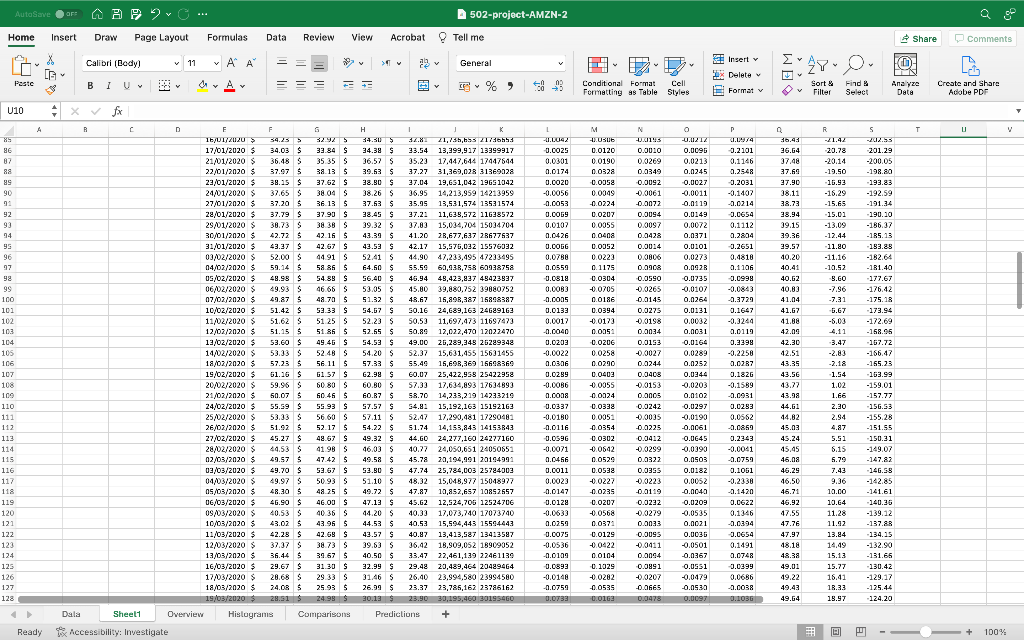
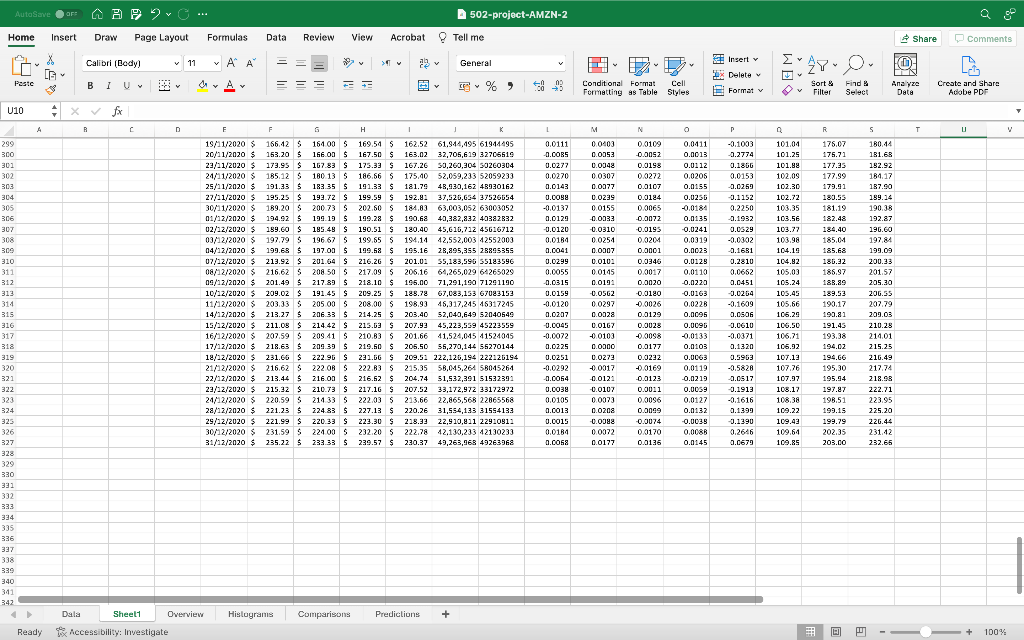
Step 4. Select a latest 2-year time interval for the analysis and enter it into an Excel worksheet. Step 5. Check the visualizations of the
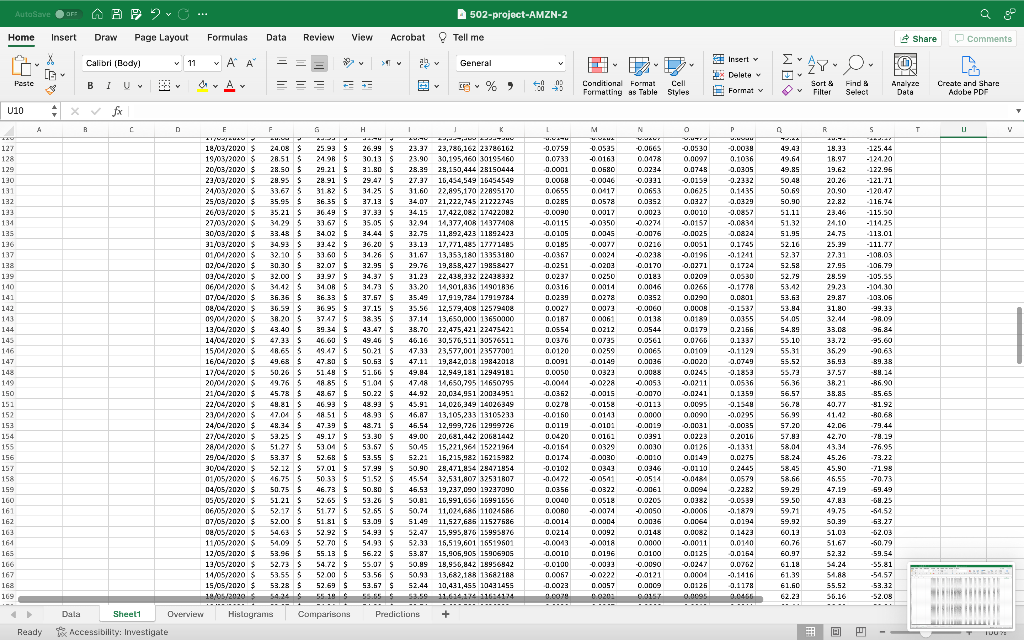
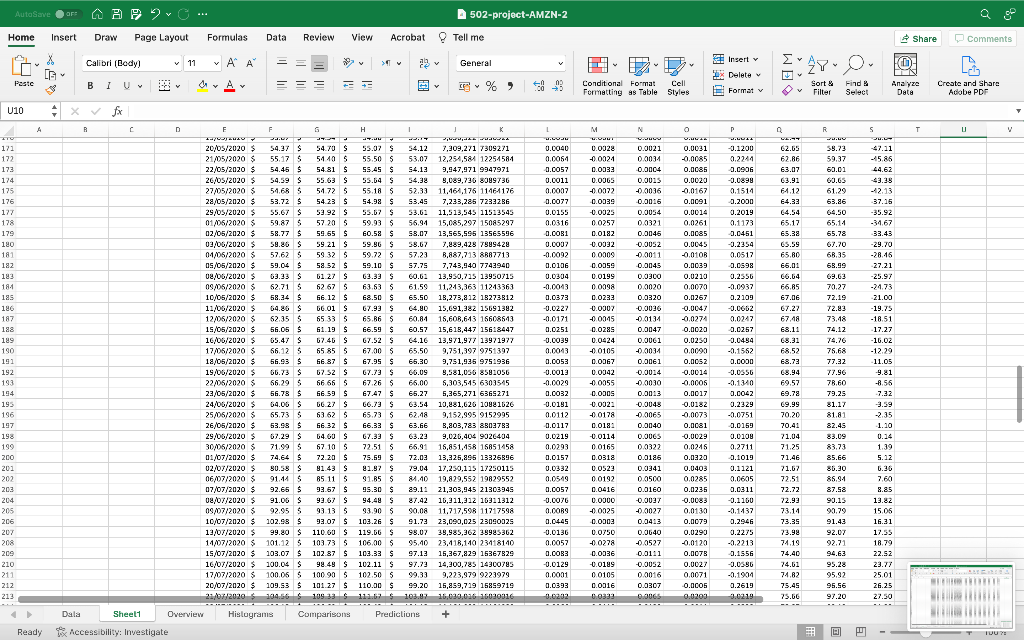
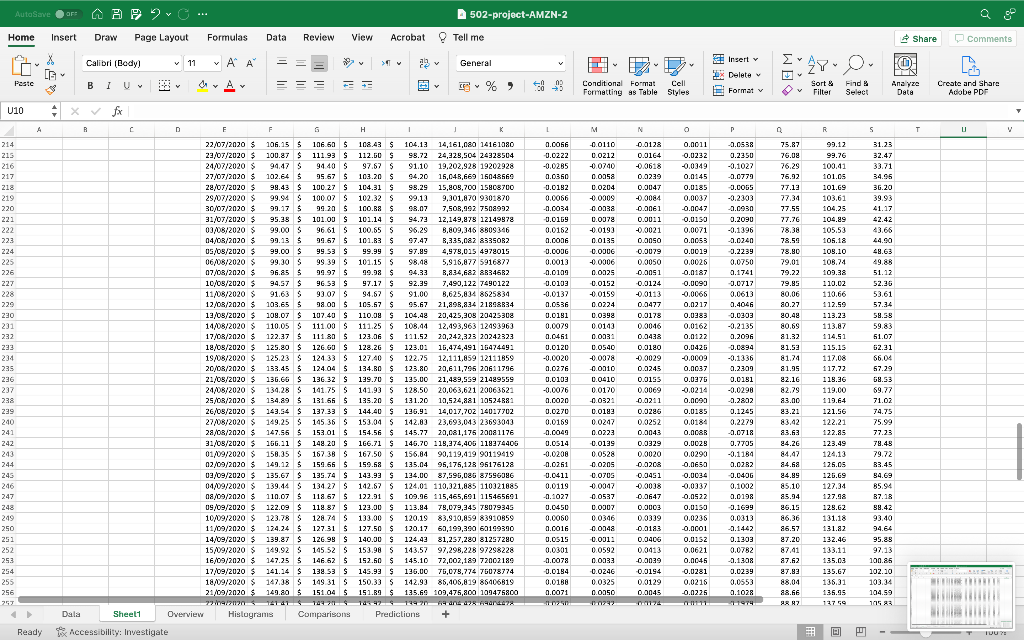
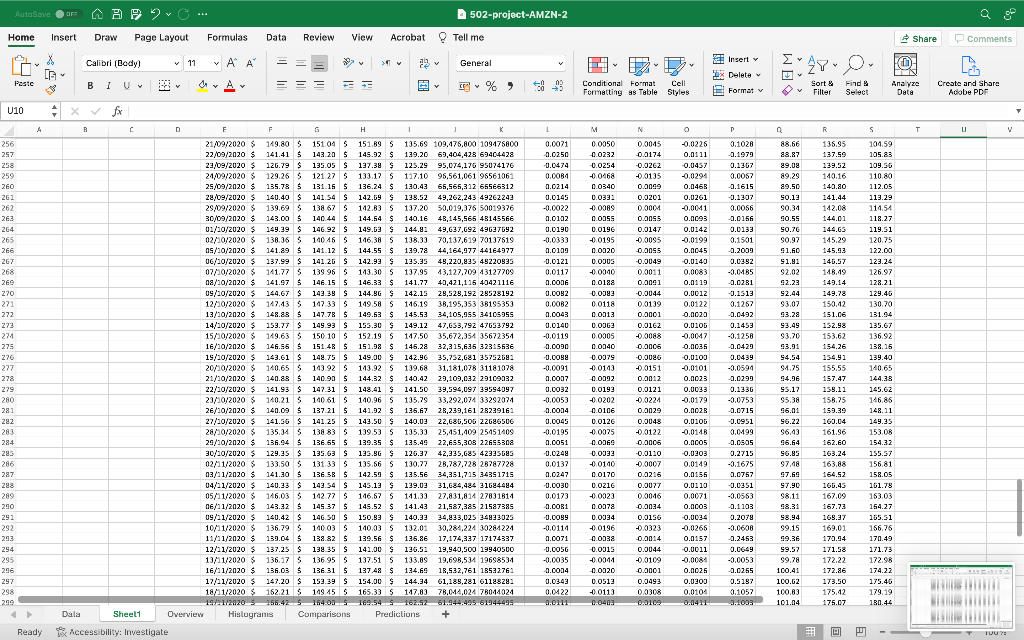
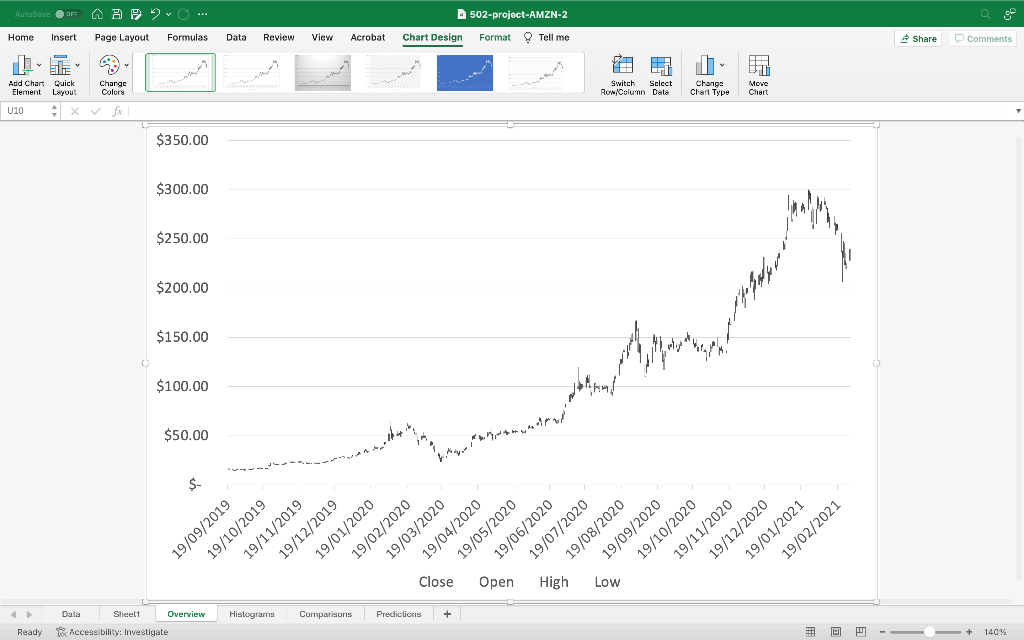
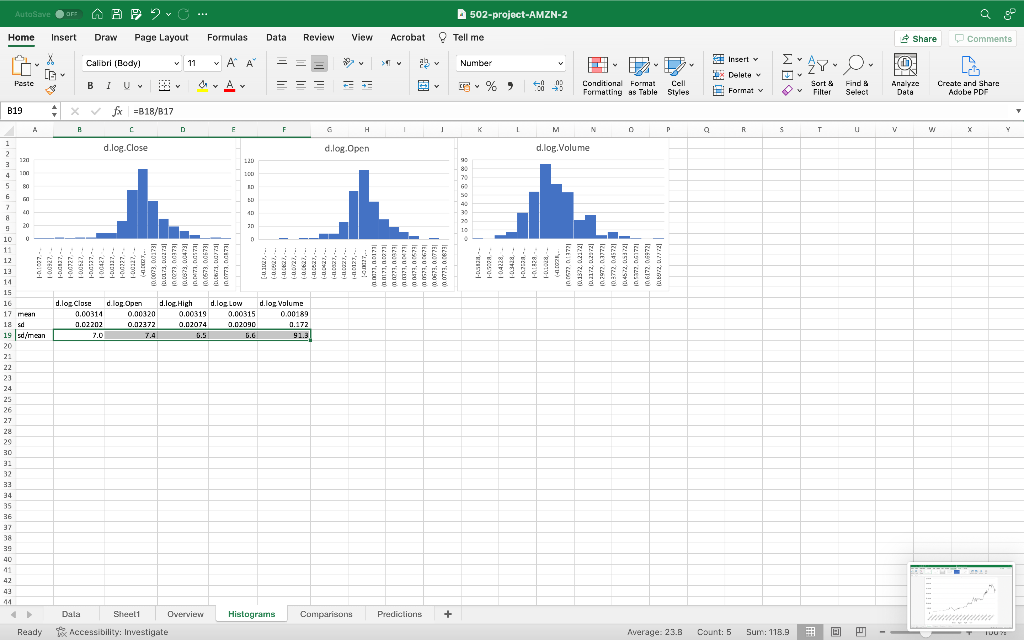
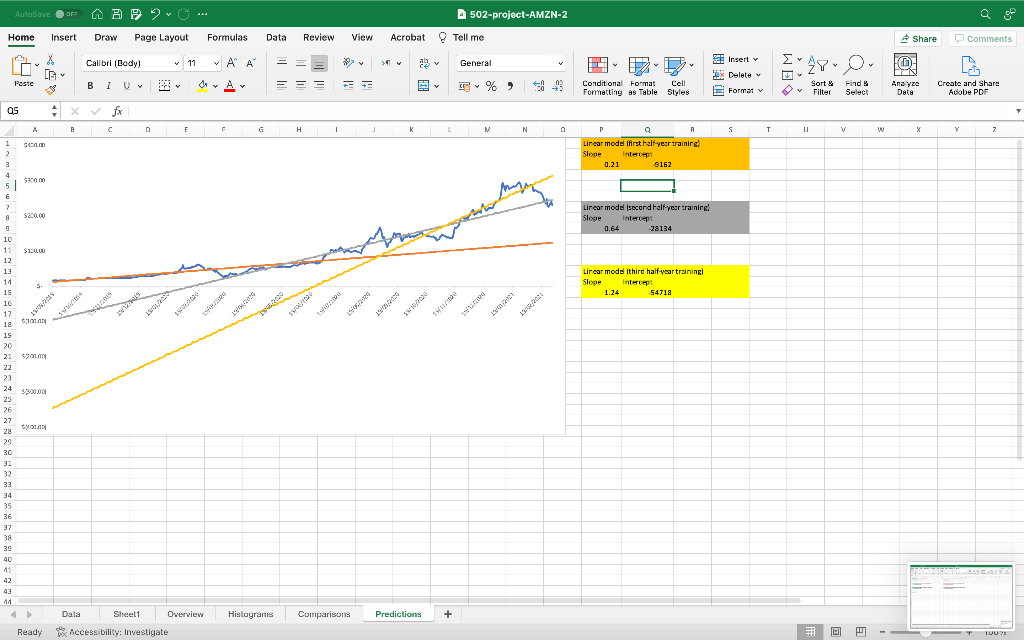
Step 4. Select a latest 2-year time interval for the analysis and enter it into an Excel worksheet. Step 5. Check the visualizations of the stock price time series and histograms (18 months automatically generated graph).
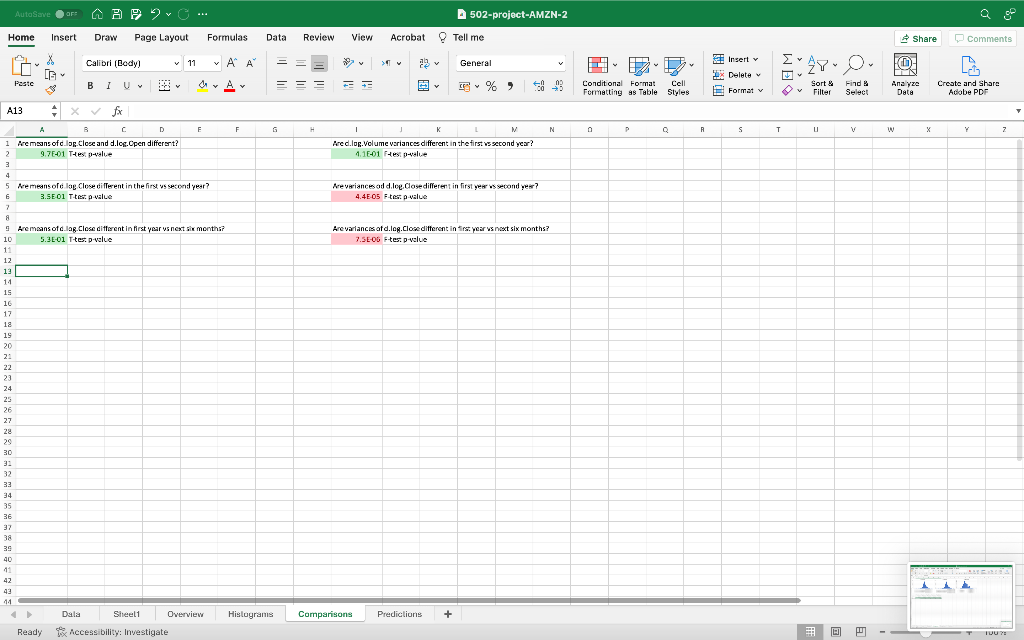
Step 6. Write a 1000 to 1500 words report describing the results that you have observed in the analysis of data from Step 5: 6.1 What data were used? How were the data acquired? How were the visualizations constructed? 6.2 Please describe the overview of the company stock price time series and the distribution of histogram, explain the indicator of std/mean below the histogram.
6.3 What were the major events that happened for the selected company in the two-year period? (For example, change of executive manager, new policies, products, marketing campaigns, operational changes) 6.4 How did these major events reflect in the data visualizations? Please arrange an appropriate structure in the report, at least including introduction, several middle sections (such as data collection and visualization, event behind data, analysis etc.) and conclusion.
Step by Step Solution
There are 3 Steps involved in it
Step: 1

Get Instant Access to Expert-Tailored Solutions
See step-by-step solutions with expert insights and AI powered tools for academic success
Step: 2

Step: 3
Ace Your Homework with AI
Get the answers you need in no time with our AI-driven, step-by-step assistance
Get Started
Behavioral Finance And Investor Types
Authors: Michael M. Pompian
1st Edition
1118011503, 978-1118011508