

Question
Stock A has expected return of 10%, a standard deviation of 19%, Stock B has expected return of 5%, a standard deviation of 8%. They
Stock A has expected return of 10%, a standard deviation of 19%, Stock B has expected return of 5%, a standard deviation of 8%. They have a correlation of -0.5. Following page 10 in M9 lecture notes, plot the efficient frontier formed by the two stocks. You must report the process, e.g., expected returns and risk of the portfolio for each weight set.
help me answer this question
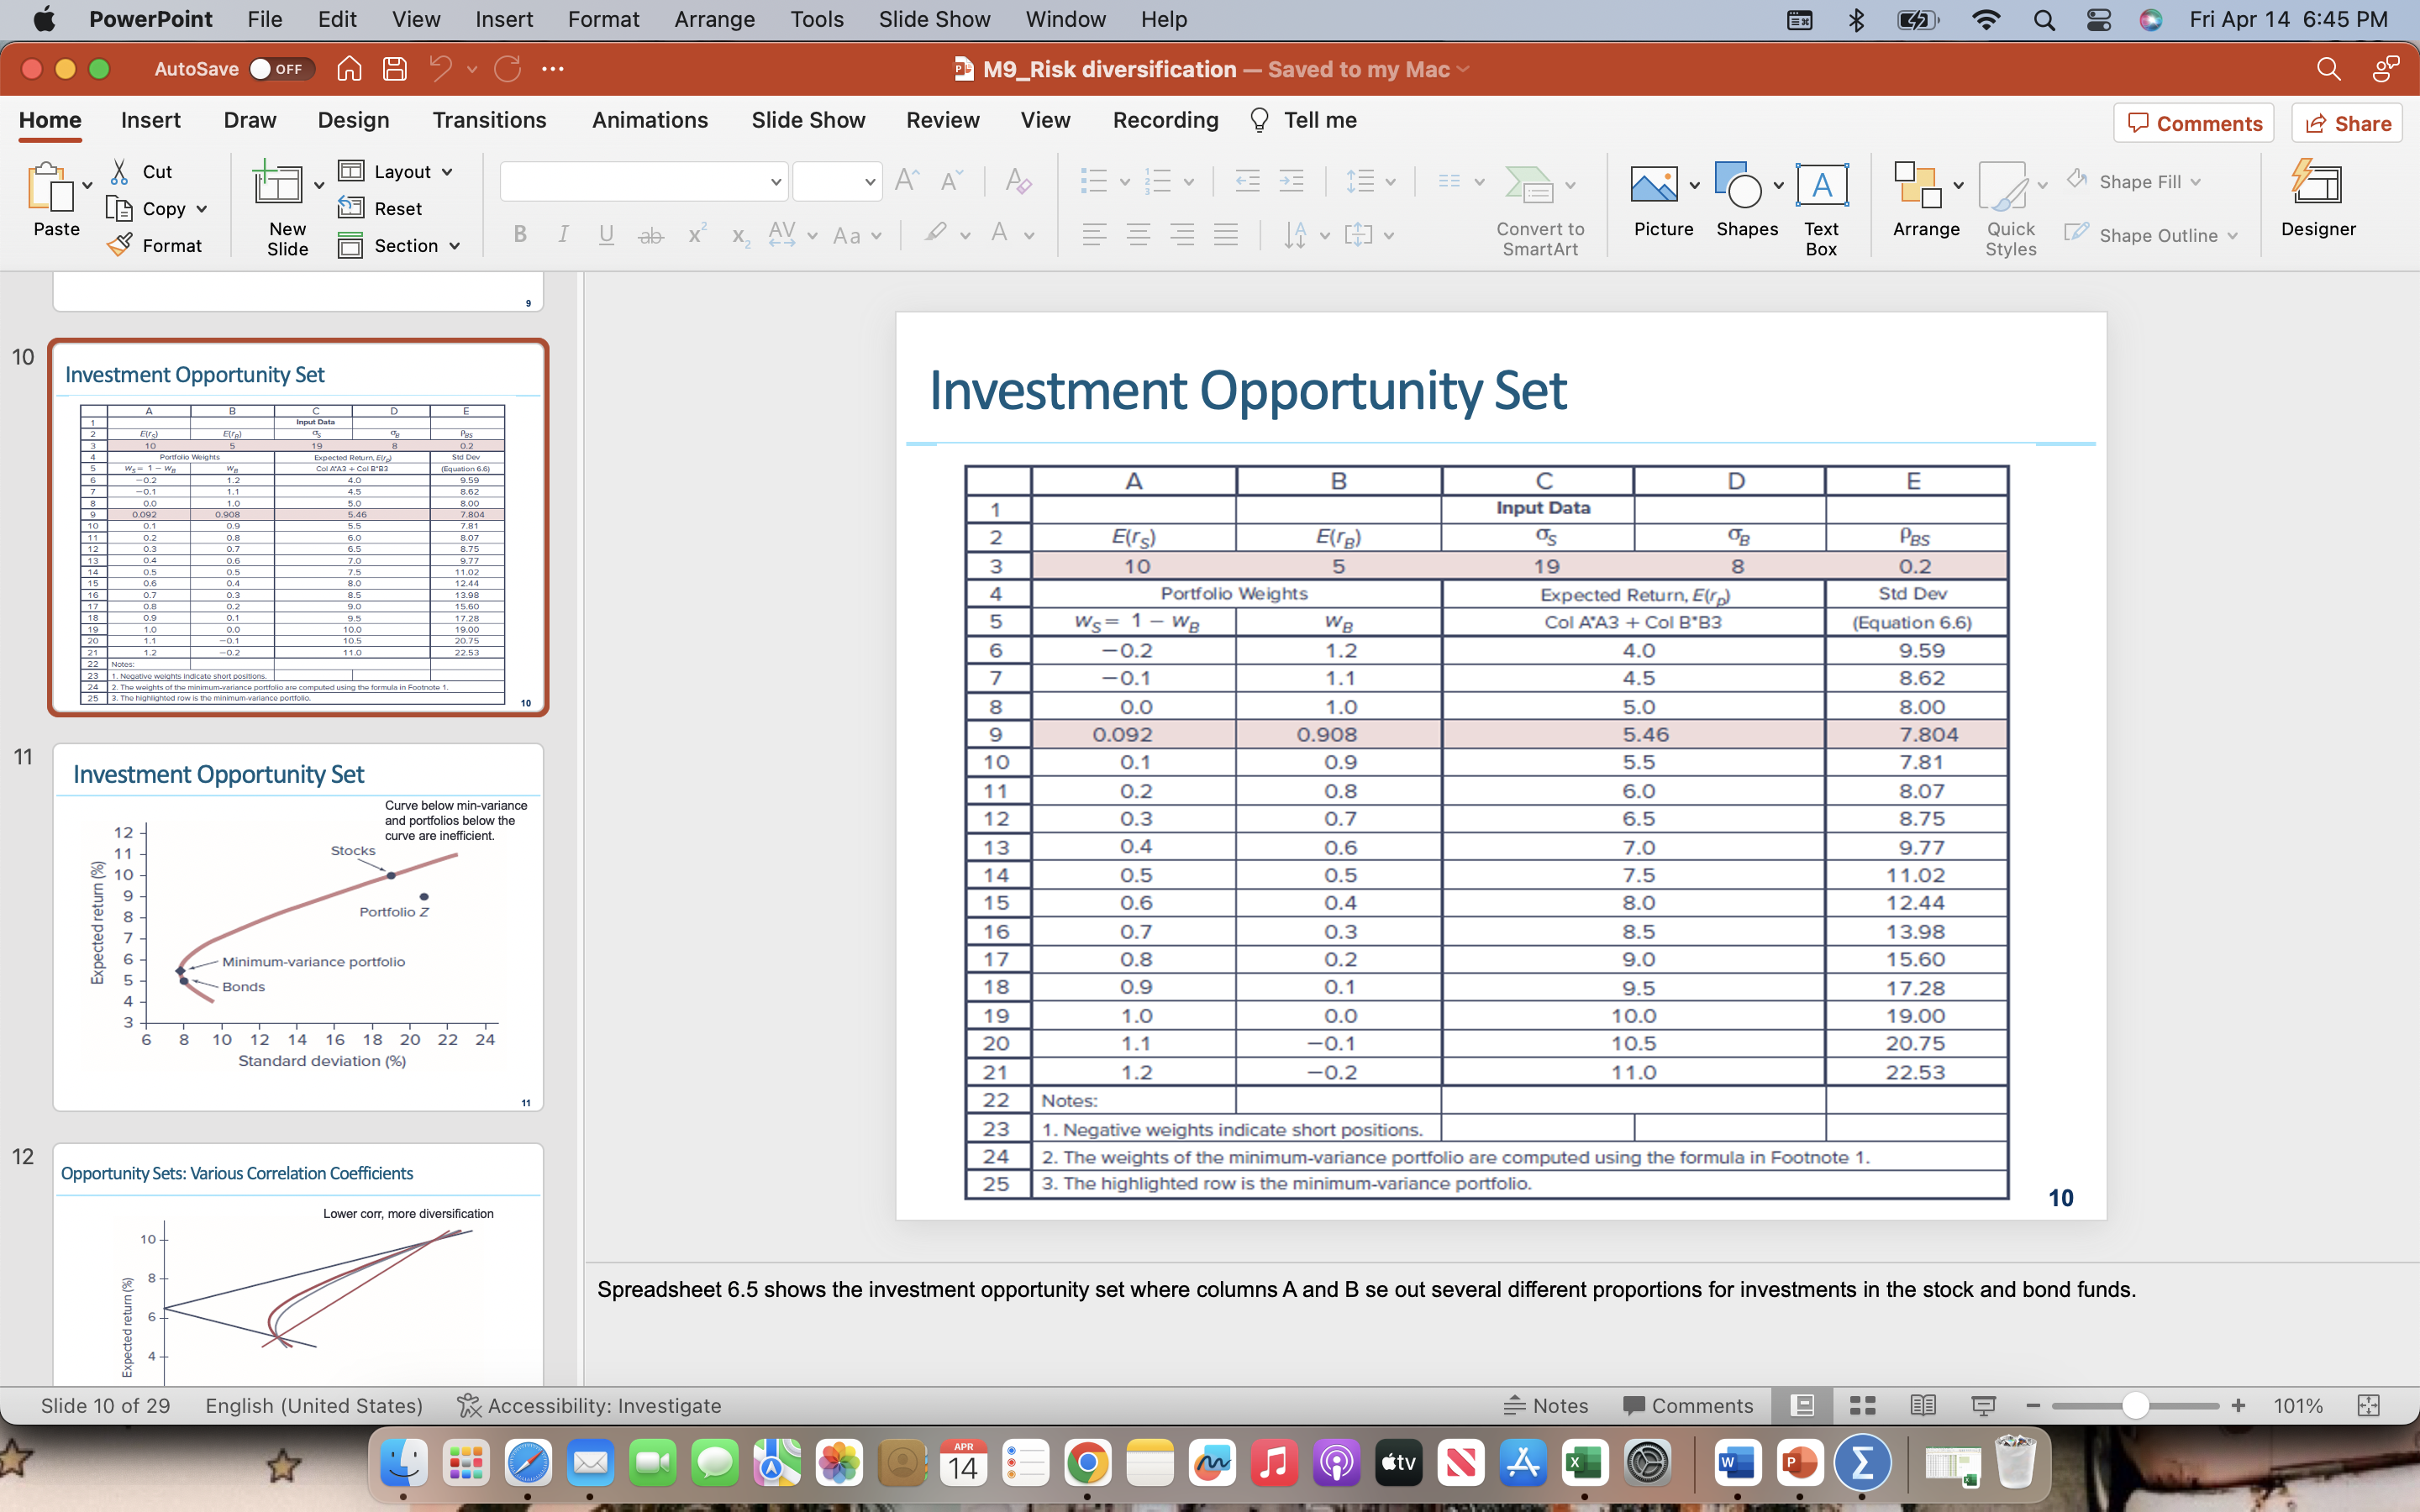 Investment Opportunity Set Investment Opportunitv Set Opportunity Sets: Various Correlation Coefficients 10 Spreadsheet 6.5 shows the investment opportunity set where columns A and B se out several different proportions for investments in the stock and bond funds
 Step by Step Solution
There are 3 Steps involved in it
Step: 1

Get Instant Access to Expert-Tailored Solutions
See step-by-step solutions with expert insights and AI powered tools for academic success
Step: 2

Step: 3
Ace Your Homework with AI
Get the answers you need in no time with our AI-driven, step-by-step assistance
Get Started
Public Finance
Authors: Harvey Rosen, Ted Gayer
8th Edition
0073511285, 9780073511283