

Answered step by step
Verified Expert Solution
Question
1 Approved Answer
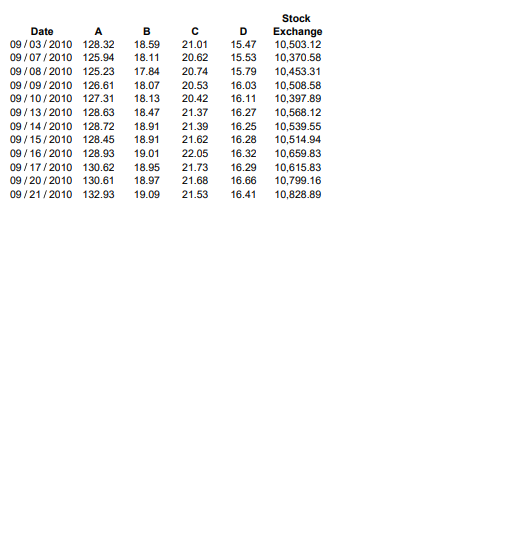
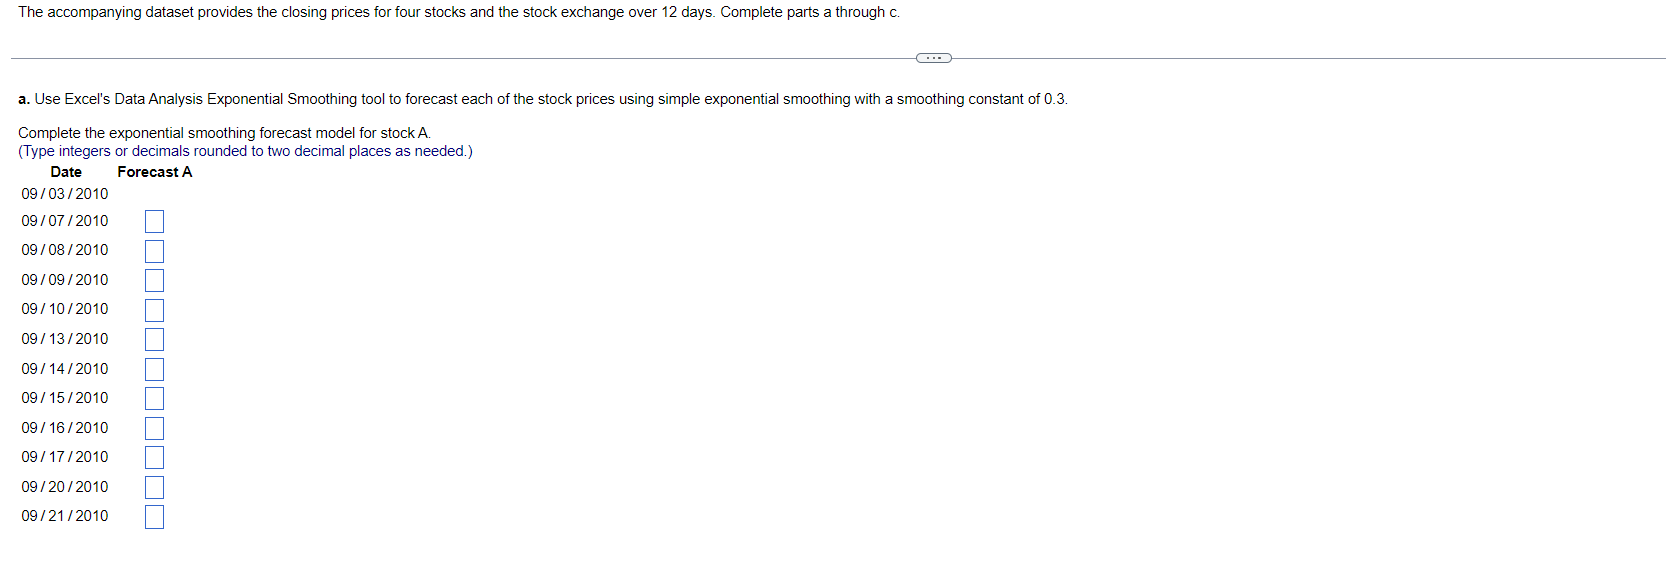
Stock Date A B C D Exchange 09 /03/2010 128.32 18.59 21.01 15.47 10,503.12 09/07 /2010 125.94 18.11 20.62 15.53 10,370.58 09 /08/2010 125.23 17.84


Step by Step Solution
There are 3 Steps involved in it
Step: 1

Get Instant Access to Expert-Tailored Solutions
See step-by-step solutions with expert insights and AI powered tools for academic success
Step: 2

Step: 3
Ace Your Homework with AI
Get the answers you need in no time with our AI-driven, step-by-step assistance
Get Started
Algebra And Number Theory An Integrated Approach
Authors: Martyn R Dixon, Leonid A Kurdachenko, Igor Ya Subbotin
1st Edition
0470640537, 9780470640531