Answered step by step
Verified Expert Solution
Question
1 Approved Answer
Stock Price Dividend Jan 1 50.11 Mar 31 51.26 0.57 Jun 30 49.59 0.57 Sep 30 51.95 0.74 Dec 31 52.39 0.74 Using the data
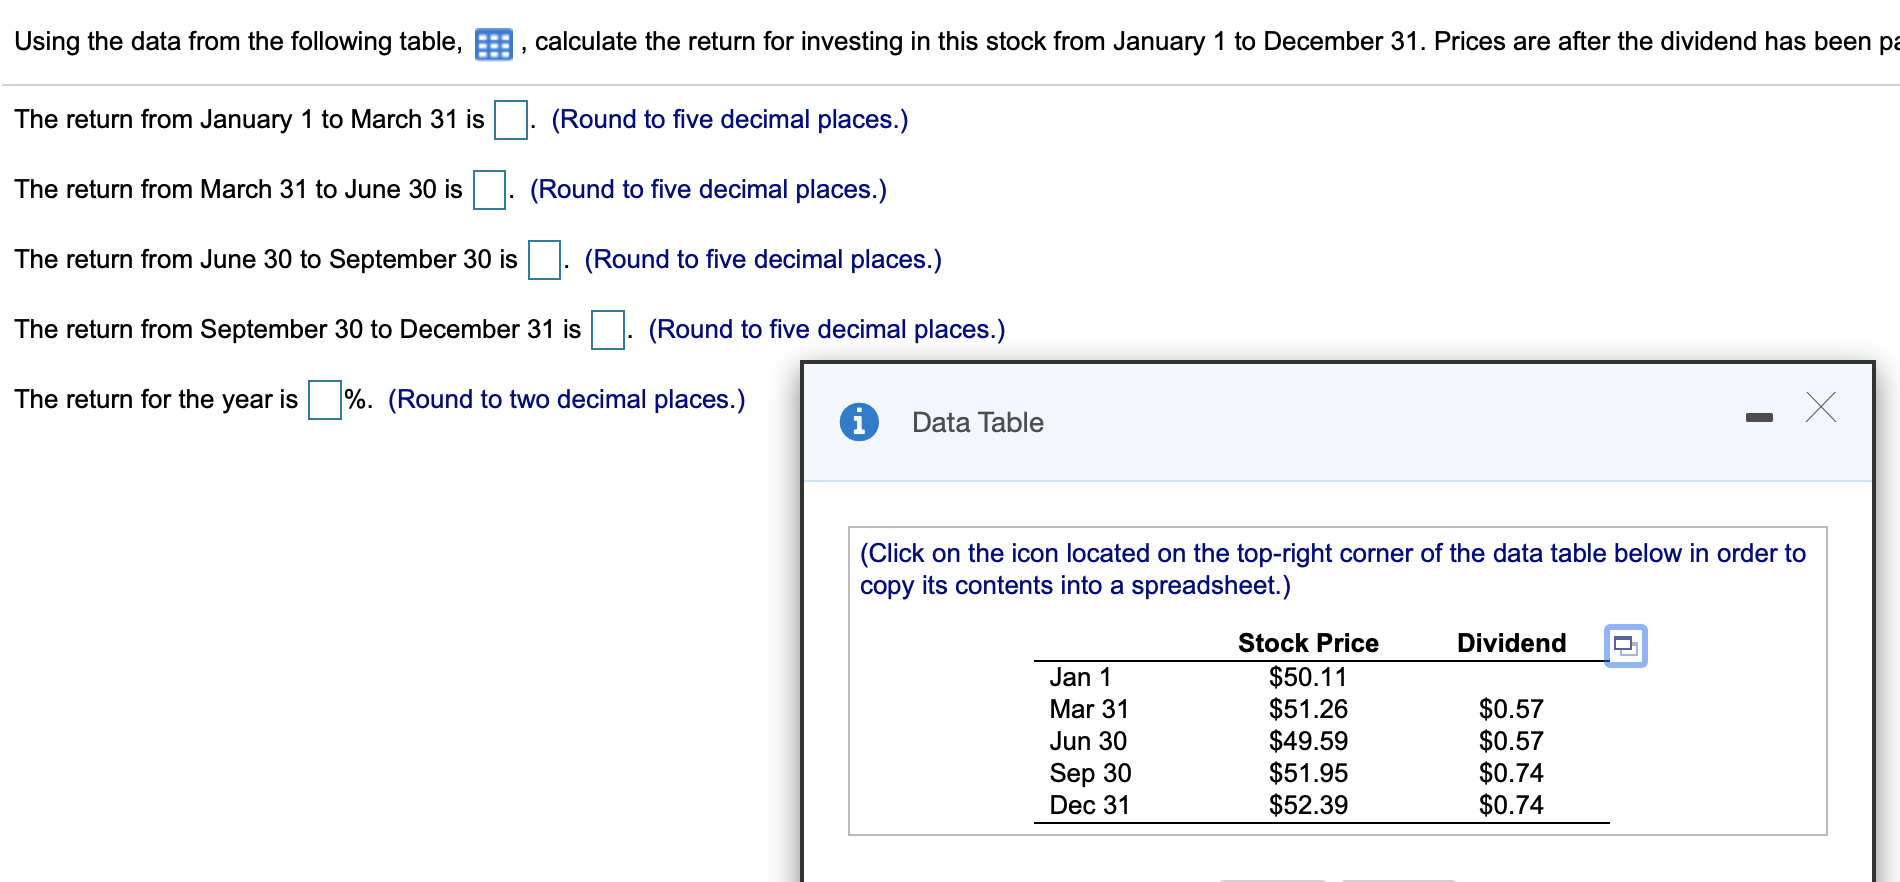
Stock Price Dividend Jan 1 50.11 Mar 31 51.26 0.57 Jun 30 49.59 0.57 Sep 30 51.95 0.74 Dec 31 52.39 0.74
Using the data from the following table, E: , calculate the return for investing in this stock from January 1 to December 31. Prices are after the dividend has been pa The return from January 1 to March 31 is (Round to five decimal places.) The return from March 31 to June 30 is (Round to five decimal places.) The return from June 30 to September 30 is (Round to five decimal places.) The return from September 30 to December 31 is (Round to five decimal places.) The return for the year is %. (Round to two decimal places.) X Data Table (Click on the icon located on the top-right corner of the data table below in order to copy its contents into a spreadsheet.) Dividend Jan 1 Mar 31 Jun 30 Sep 30 Dec 31 Stock Price $50.11 $51.26 $49.59 $51.95 $52.39 $0.57 $0.57 $0.74 $0.74Step by Step Solution
There are 3 Steps involved in it
Step: 1
Get Instant Access to Expert-Tailored Solutions
See step-by-step solutions with expert insights and AI powered tools for academic success
Step: 2
Step: 3
Ace Your Homework with AI
Get the answers you need in no time with our AI-driven, step-by-step assistance
Get Started