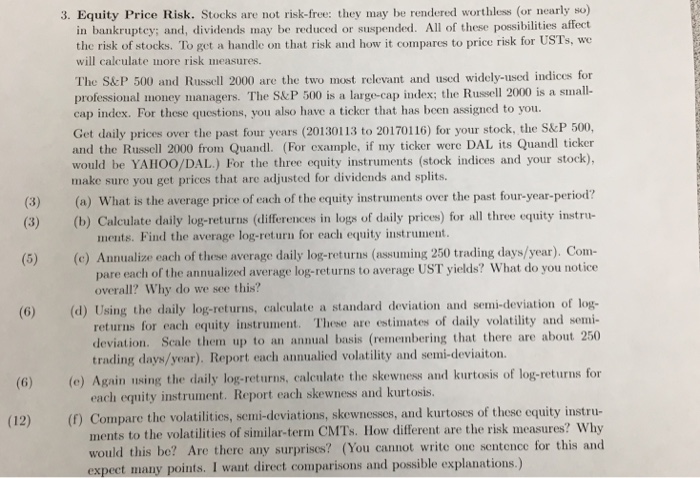
Stocks an- not risk-free: they may be rendered worthier (or nearly so) in bankruptey; and, dividends may be reduced or suspended. All of these possibilities affect tin risk of stocks. To get a handle on that risk and how it compares to price risk for USTs, we will calculate more risk measures. The S&P 500 and Russell 2000 are the two most relevant and used widely-used indices for professional money managers. The S&P 500 is a large-cap index; the Russell 2000 is a small-cap index. For these questions, you also have a ticker that has been assigned to you. Get daily prices over the past four years (20130113 to 20170116) for your stock, the S&P 500, and the Russell 2000 from Quandl. (For example, if my ticker were DAL its Quandl ticker would be YAHOO/DAL.) For the three equity instruments (stock indices and your stock), make sure you gel prices that are adjusted for dividends and splits. (a) What is the average price of each of the equity instruments over the past four-year-period? (b) Calculate daily log-returns (differences in logs of daily prices) for all three equity instruments Find the average log-return for each equity instrument. (c) Annualize each of these average daily log-returns (assuming 250 trading days/year). Compare each of the annualized average log-returns to average UST yields? What do you notice overall? Why do we see this? (d) Using the daily log-returns, calculate a standard deviation and semi-deviation of log-returns for each equity instrument. These are estimates of daily volatility and semi-deviation. Scale them up to an annual basis (remembering that there are about 250 trading days/year). Report each annualied volatility and semi-deviation. (e) Again fluting tin- daily log-returns, calculate I lie skewness and kurtosis of log-returns for each equity instrument. Report each skewness and kurtosis. (f) Compare the volatilities, semi-deviations, skewnesses, and kurtoses of these equity instruments to the volatilities of similar-term CMTs. How different are the risk measures? Why would this be? Are there any surprises? (You cannot write one sentence for this and expect many points. I want direct comparisons and possible explanations.)