

Question
Stopping Distances The U.S. Department of Transportation (DOT) tests the braking abilities of various cars. For this experiment, DOT measured the stopping distances on dry
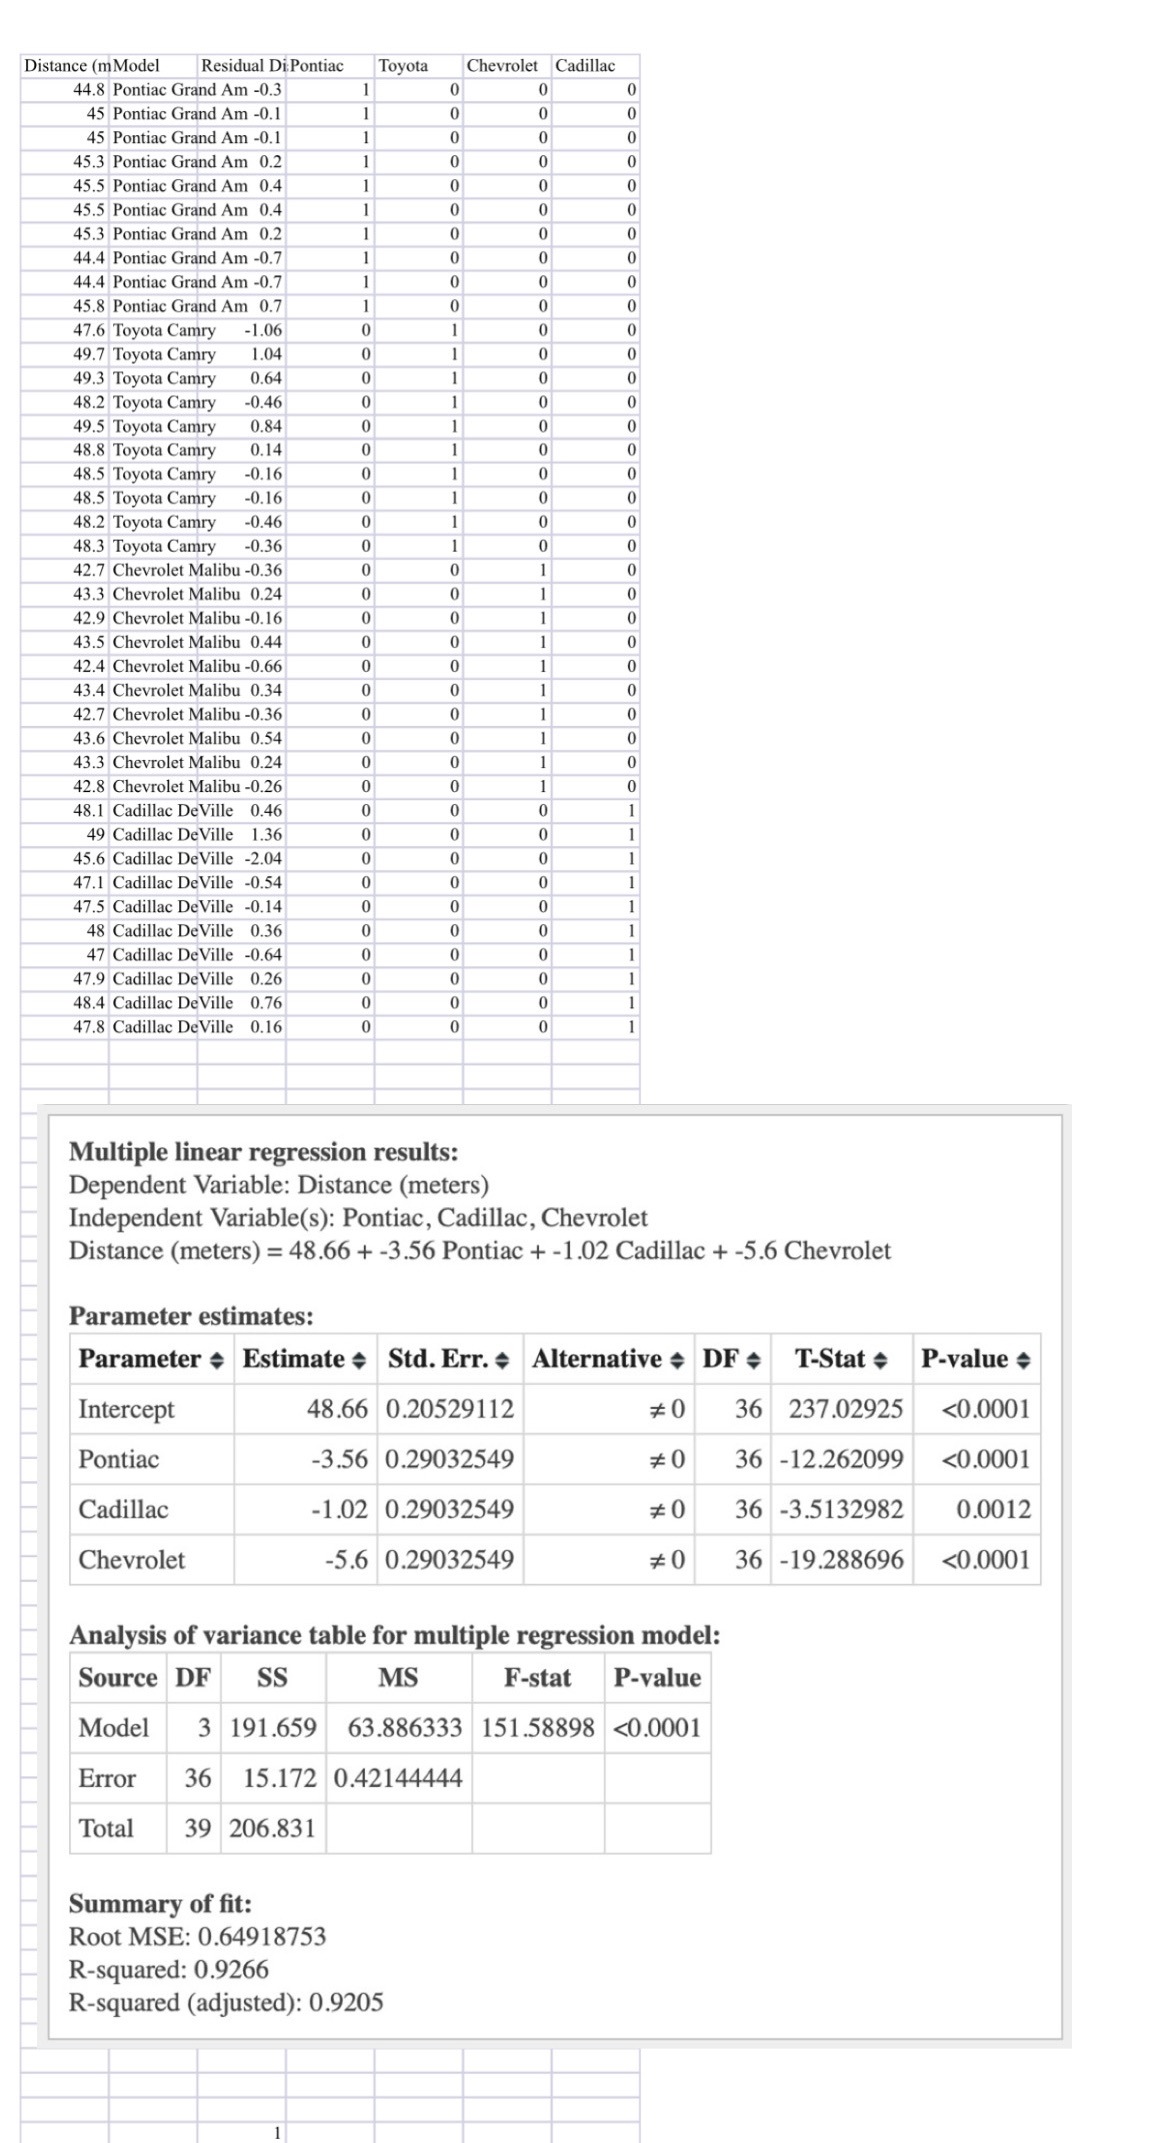
Stopping Distances The U.S. Department of Transportation (DOT) tests the braking abilities of various cars. For this experiment, DOT measured the stopping distances on dry pavement at 100 kph (kilometers per hour, about 62 mph) of four models: a Chevrolet Malibu, Toyota Camry, Pontiac Grand Am, and Cadillac DeVille. Each car accelerated to 100 kilometers per hour on a test track; then the brakes were applied. The distance required to come to a full stop was measured, in meters. The test was repeated for each car 10 times under identical conditions.(a) Plot the data. From your visual inspection of the plot, do you think there are statistically signif-cant differences among these four cars?(b) Fit a multiple regression of stopping distance on three dummy variables that identify the Malibu, Grand Am, and Cadillac. Interpret the estimated intercept and slopes.(c) Does a statistical test agree with your visual impression? Test the null hypothesis that the four cars have the same stopping distance.(d) These stopping distances were recorded in meters. Would the analysis change had the distances been measured in feet instead?(e) Do these data meet the conditions required for an ANOVA?(f) Based on these results, what should we conclude about differences in the stopping distance of other cars of these models?Can you answer this questions and I need a detailed answer with illustrations and graphs to explain the answers in details. It's for a reportKindly use this data preferably on stat crunch My pleasure
Step by Step Solution
There are 3 Steps involved in it
Step: 1

Get Instant Access to Expert-Tailored Solutions
See step-by-step solutions with expert insights and AI powered tools for academic success
Step: 2

Step: 3
Ace Your Homework with AI
Get the answers you need in no time with our AI-driven, step-by-step assistance
Get Started
Linear Algebra with Applications
Authors: Steven J. Leon
7th edition
131857851, 978-0131857858