

Question: Storm data (Fig. P2.9) were recorded for a storm over a 205-acre basin on September 1, 1999. Approximations for the rainfall and runoff cumulative
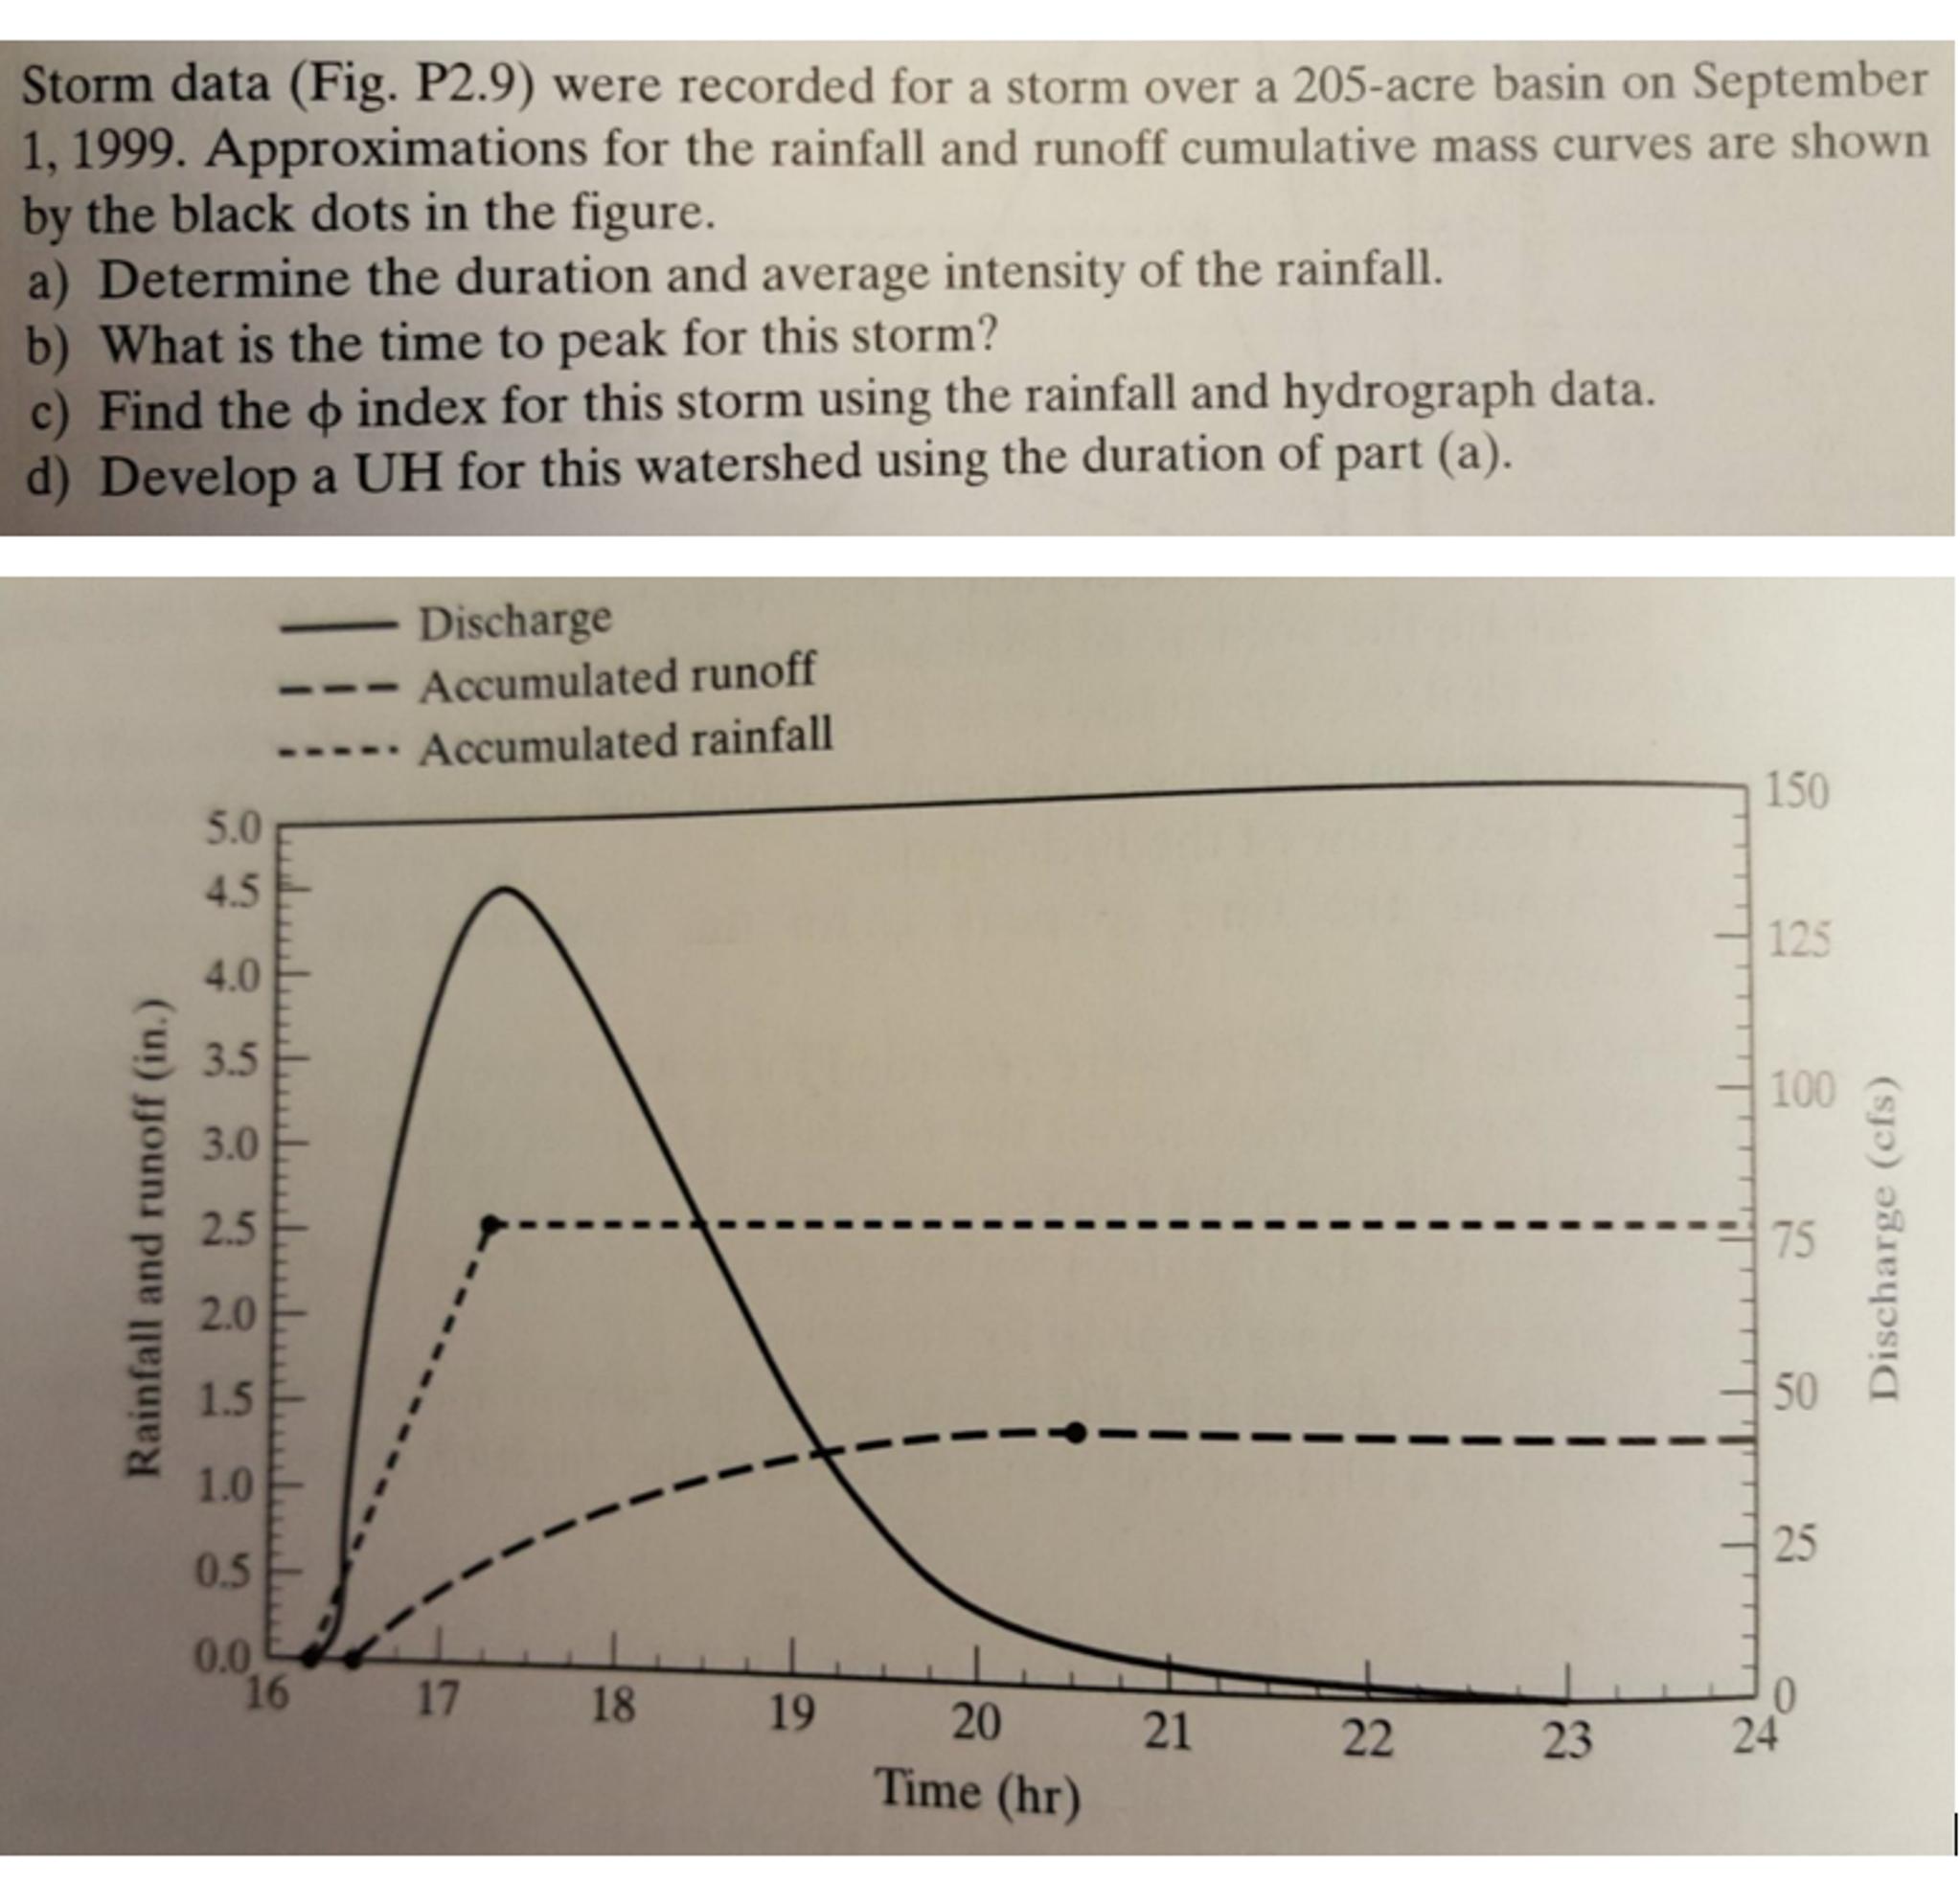
Storm data (Fig. P2.9) were recorded for a storm over a 205-acre basin on September 1, 1999. Approximations for the rainfall and runoff cumulative mass curves are shown by the black dots in the figure. a) Determine the duration and average intensity of the rainfall. b) What is the time to peak for this storm? c) Find the index for this storm using the rainfall and hydrograph data. d) Develop a UH for this watershed using the duration of part (a). Discharge Accumulated runoff -- Accumulated rainfall 150 5.0 4.5 125 4.0 3.5 100 3.0 2.5 75 2.0 1.5 50 1.0 25 0.5 0.0 16 17 18 19 20 21 24 23 Time (hr) Rainfall and runoff (in.) 22 Discharge (cfs)
Step by Step Solution
3.45 Rating (155 Votes )
There are 3 Steps involved in it

Get step-by-step solutions from verified subject matter experts
Document Format (2 attachments)
6361023cd4f83_235022.pdf
180 KBs PDF File
6361023cd4f83_235022.docx
120 KBs Word File