Question
strukturanalys Task 1 IR spectrum of compound A a) the y-axis it says absorbance or transmittance. What is the relationship between these? b) The X-axis
strukturanalys
Task 1 IR spectrum of compound A
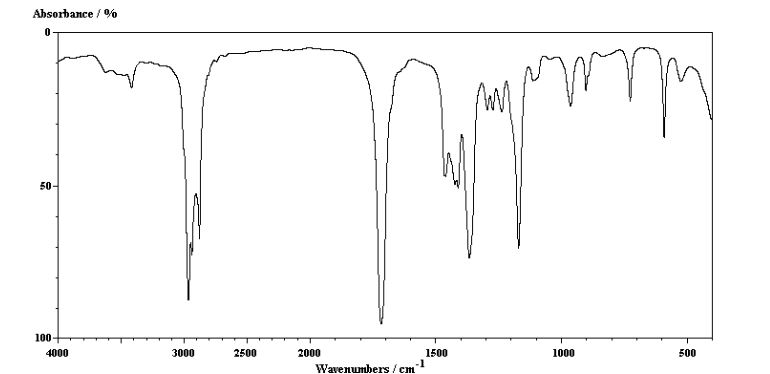
a) the y-axis it says absorbance or transmittance. What is the relationship between these? b) The X-axis shows the wavelength or wavelength. What is the relationship between these? c) Based on the spectrum above, tell which functional groups exist and are missing. Forget not to discuss the carbon skeleton (single, double and / or triple bonds as well aromatics).
Task 2 Mass spectrum (MS) for compound A
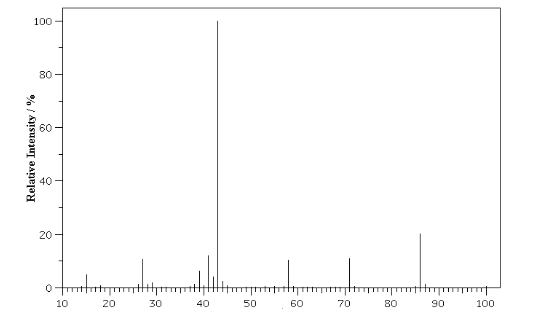
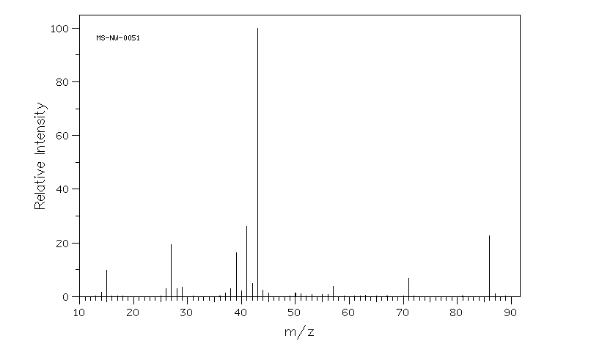
a) What charge do the ions have in the mass spectrum above? motivate your answer b) What information about the unknown compound do you get from the above mass spectrum ?, justify your answer. c) Use the information you have received from the IR section and try to figure out which one association it is. There are at least two different compounds that give about the same mass spectrum, which ones? the mass spectrum of the isomer can be found below.
Task 3 High resolution NMR for compound A in figure below
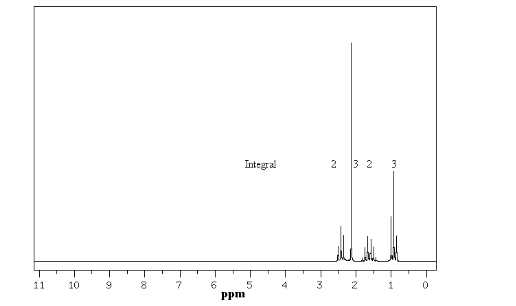
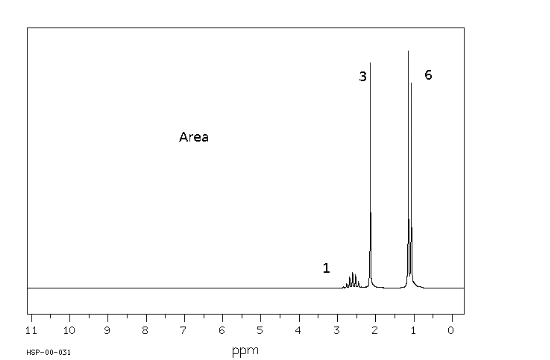
a) What information do you get from NMR spectrum for compound A? in your discussion should shift, areas and splits are included. b) What information do you get from the NMR spectrum of the isomer to compound A? In your discussion, shifts, areas and splits must be included. c) With the collected information from IR, MS and NMR which compound is the isomer and compound A.
NMR spectrum of the isomer to compound A i figure below
Task 4: Low-resolution NMR
NMR spectra for compound A, 60 MHz, area of the peaks in the boxes above the peaks in figure below

NMR spectrum of the isomer to compound A 60MHz, area of the peaks in the boxes above the peaks in figure below

NMR spectrum of the isomer to compound A 600 MHz, area of the peaks in the boxes above the peaks. in figure below

a) What information do you get from NMR spectrum (60 MHz) for compound A and the isomer? IN your discussion should include shifts, areas and splits. b) For the isomer, there are simulated NMR spectra for both 600 MHz and 60 MHz above. Compare these and tell what information you have lost when you do the analysis with one low-resolution instruments. c) We know that the switching constant J is 7.03 Hz. Why is the distance between the peaks in one split differently when analyzing the isomer with a 60 MHz and 600 MHz NMR, respectively.
Absorbance / % 0 w 50- 100 4000 3000 2500 1000 500 2000 1500 -1 Wave numbers /cm 100- 80 60 Relative Intensity / % 40 20 - 0 10 tot 90 100 20 30 40 50 60 70 80 100 MS-NI-0051 80 60 Relative Intensity 40 20 o to 10 zo 30 40 50 60 70 80 90 m/z Integral 2 3 2 3 3 - 11 10 9 00 7 4 3 2 1 0 6 5 Ppm 3 6 Area 1 11 10 7 1 5 00 6 T 3 4 2 1 0 HSP-00-031 ppm IN 1 humth 5 3 2 0 oppim T - 5 3 2 0 5 0
Step by Step Solution
There are 3 Steps involved in it
Step: 1

Get Instant Access to Expert-Tailored Solutions
See step-by-step solutions with expert insights and AI powered tools for academic success
Step: 2

Step: 3

Ace Your Homework with AI
Get the answers you need in no time with our AI-driven, step-by-step assistance
Get Started


