Answered step by step
Verified Expert Solution
Question
1 Approved Answer
Study the results given in Table 1 and answer the questions listed below. These results have been calculated using the 51-week data of the selected

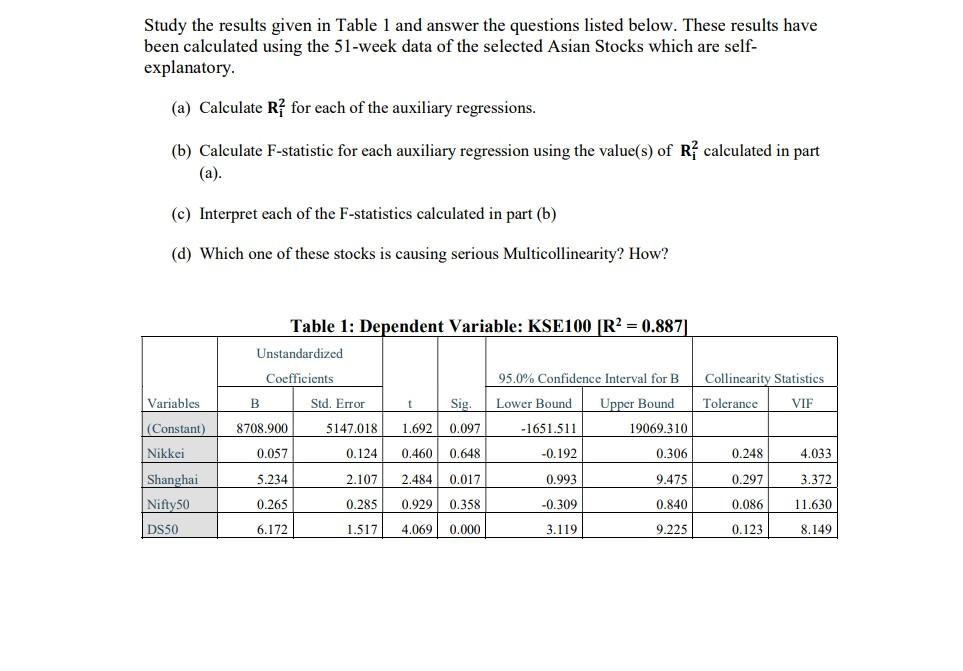
Study the results given in Table 1 and answer the questions listed below. These results have been calculated using the 51-week data of the selected Asian Stocks which are self- explanatory. (a) Calculate R? for each of the auxiliary regressions. (b) Calculate F-statistic for each auxiliary regression using the value(s) of R? calculated in part (a). (c) Interpret each of the F-statistics calculated in part (b) (d) Which one of these stocks is causing serious Multicollinearity? How? Table 1: Dependent Variable: KSE100 [R2 = 0.887) Unstandardized Coefficients 95.0% Confidence Interval for B Collinearity Statistics Variables B Std. Error Lower Bound Tolerance VIF Upper Bound 19069.310 5147.018 -1651.511 (Constant) ) Nikkei 8708.900 0.057 0.124 -0.192 0.306 0.248 4.033 t Sig. . 1.692 0.097 0.460 0.648 2.484 0.017 0.929 0.358 4.069 0.000 5.234 2.107 0.993 9.475 0.297 3.372 Shanghai Nifty50 0.265 0.285 -0.309 0.840 0.086 11.630 DS50 6.172 1.517 3.119 9.225 0.123 8.149
Step by Step Solution
There are 3 Steps involved in it
Step: 1

Get Instant Access to Expert-Tailored Solutions
See step-by-step solutions with expert insights and AI powered tools for academic success
Step: 2

Step: 3

Ace Your Homework with AI
Get the answers you need in no time with our AI-driven, step-by-step assistance
Get Started


