Answered step by step
Verified Expert Solution
Question
1 Approved Answer
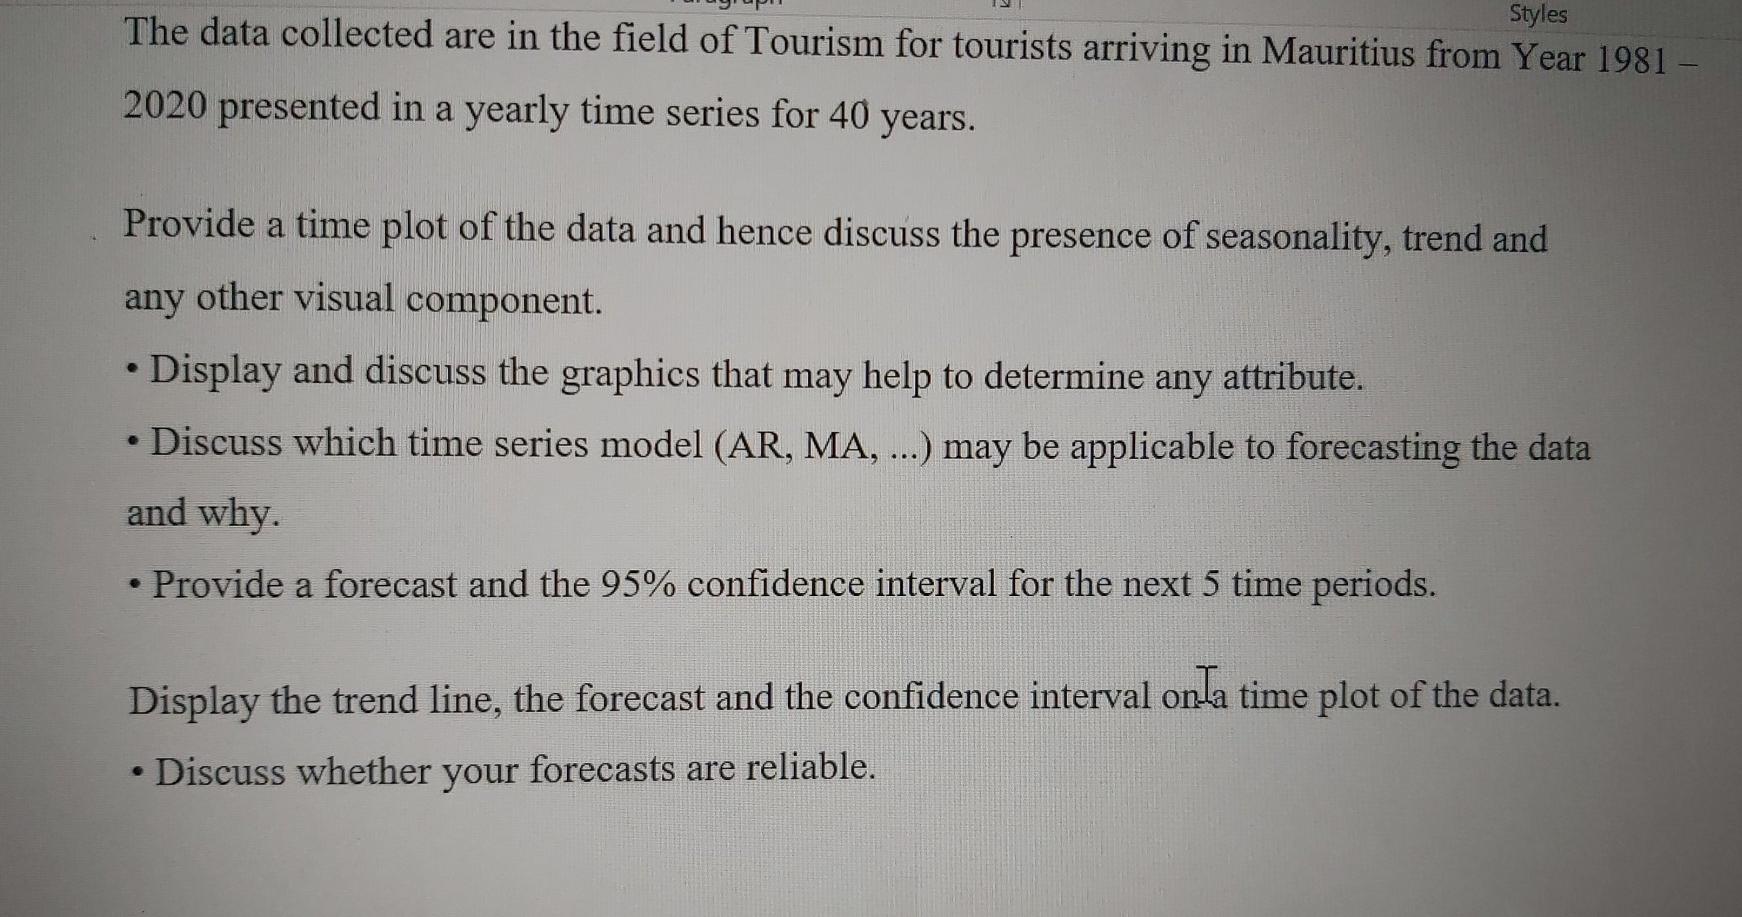
Styles The data collected are in the field of Tourism for tourists arriving in Mauritius from Year 1981 - 2020 presented in a yearly time


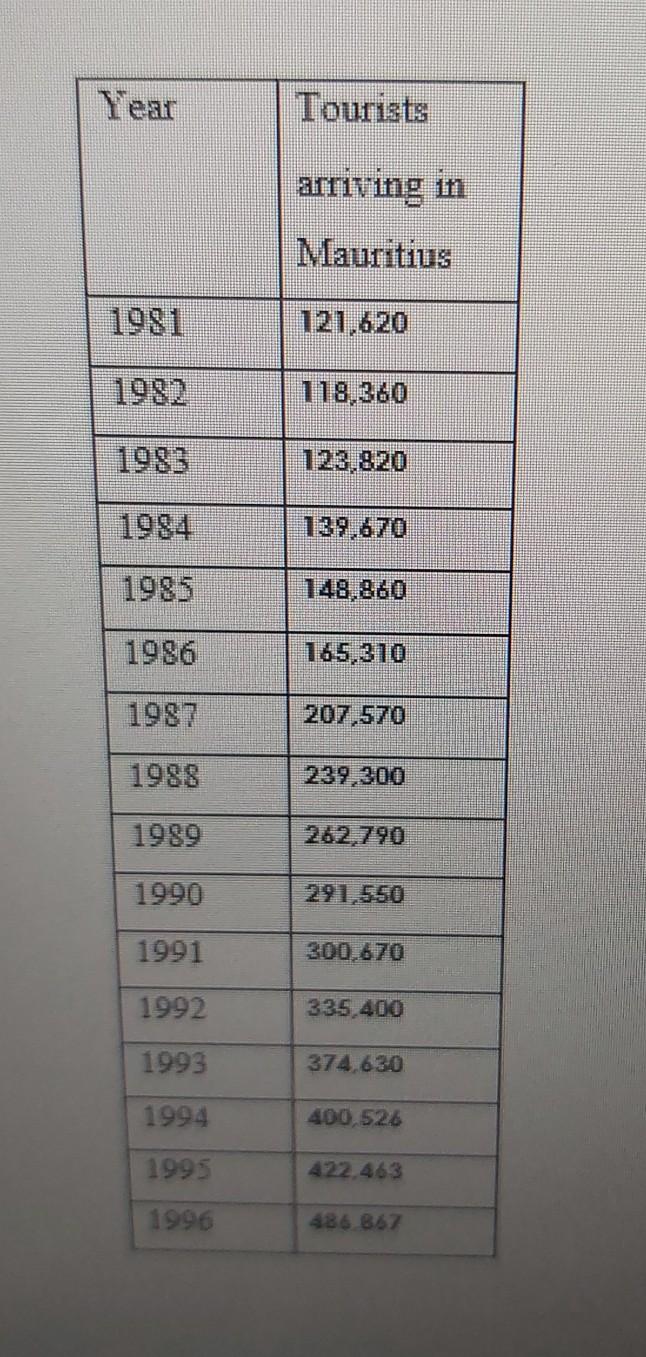
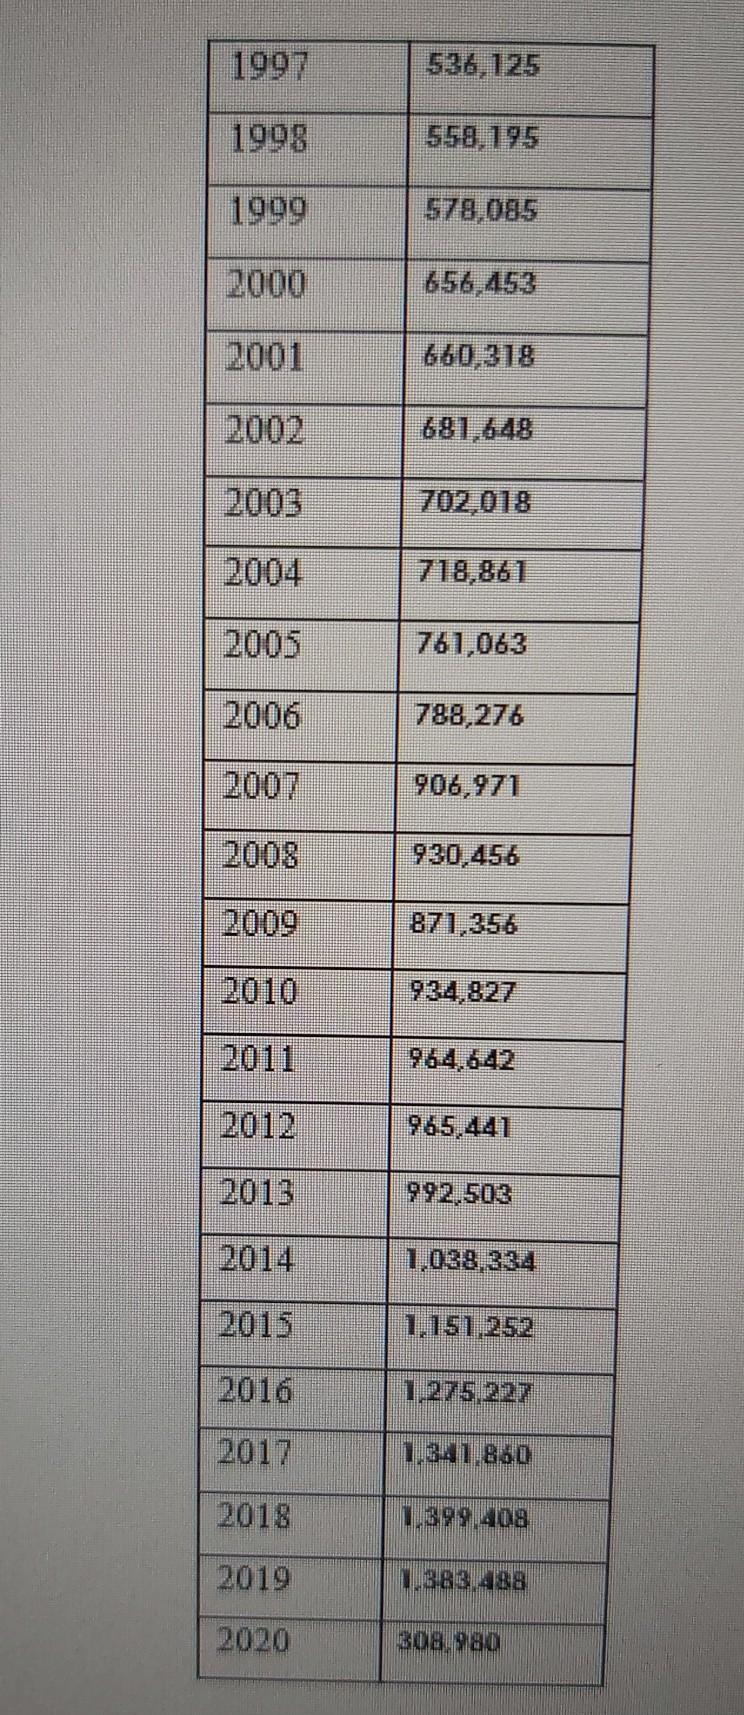
Styles The data collected are in the field of Tourism for tourists arriving in Mauritius from Year 1981 - 2020 presented in a yearly time series for 40 years. Provide a time plot of the data and hence discuss the presence of seasonality, trend and any other visual component. Display and discuss the graphics that may help to determine any attribute. Discuss which time series model (AR, MA, ...) may be applicable to forecasting the data and why. Provide a forecast and the 95% confidence interval for the next 5 time periods. a Display the trend line, the forecast and the confidence interval onla time plot of the data. Discuss whether your forecasts are reliable. @ Year Tourists arriving in Mauritius 121,620 118,360 1983 123.820 139,670 1985 148.860 1986 165,310 207,570 1988 239,300 1989 262,790 1990 291.550 1991 300.670 1992 335,400 1993 374.630 1994 400 526 1995 422.463 1996 486 867 B08980 OTOC 1383 488 610Z 807 669 81OZ LIOT LCT STI 910T 1,151,252 CIOC 1,038,334 992,503 2013 965.441 TIOT CP9798 934,827 OIOZ 871,356 6007 930,456 6 8007 906,971 2007 788,276 9007 761,063 5007 198'812 702018 5007 879*189 2007 81 099 IOOZ SV 999 578,085 6661 $6LBSS 8661 SZI985 1661 Styles The data collected are in the field of Tourism for tourists arriving in Mauritius from Year 1981 - 2020 presented in a yearly time series for 40 years. Provide a time plot of the data and hence discuss the presence of seasonality, trend and any other visual component. Display and discuss the graphics that may help to determine any attribute. Discuss which time series model (AR, MA, ...) may be applicable to forecasting the data and why. Provide a forecast and the 95% confidence interval for the next 5 time periods. a Display the trend line, the forecast and the confidence interval onla time plot of the data. Discuss whether your forecasts are reliable. @ Year Tourists arriving in Mauritius 121,620 118,360 1983 123.820 139,670 1985 148.860 1986 165,310 207,570 1988 239,300 1989 262,790 1990 291.550 1991 300.670 1992 335,400 1993 374.630 1994 400 526 1995 422.463 1996 486 867 B08980 OTOC 1383 488 610Z 807 669 81OZ LIOT LCT STI 910T 1,151,252 CIOC 1,038,334 992,503 2013 965.441 TIOT CP9798 934,827 OIOZ 871,356 6007 930,456 6 8007 906,971 2007 788,276 9007 761,063 5007 198'812 702018 5007 879*189 2007 81 099 IOOZ SV 999 578,085 6661 $6LBSS 8661 SZI985 1661
Step by Step Solution
There are 3 Steps involved in it
Step: 1

Get Instant Access to Expert-Tailored Solutions
See step-by-step solutions with expert insights and AI powered tools for academic success
Step: 2

Step: 3

Ace Your Homework with AI
Get the answers you need in no time with our AI-driven, step-by-step assistance
Get Started


