

Answered step by step
Verified Expert Solution
Question
1 Approved Answer
subject- investment...please draw the graph and give the explanation of the CAL A pension fund manager is considering three mutual funds. The first is a
subject- investment...please draw the graph and give the explanation of the CAL 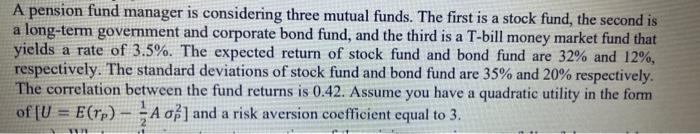
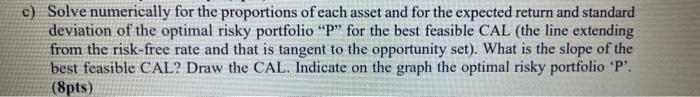 A pension fund manager is considering three mutual funds. The first is a stock fund, the second is a long-term government and corporate bond fund, and the third is a T-bill money market fund that yields a rate of 3.5%. The expected return of stock fund and bond fund are 32% and 12%, respectively. The standard deviations of stock fund and bond fund are 35% and 20% respectively. The correlation between the fund returns is 0.42. Assume you have a quadratic utility in the form of [U=E(rp)21AP2] and a risk aversion coefficient equal to 3 . Solve numerically for the proportions of each asset and for the expected return and standard deviation of the optimal risky portfolio "P" for the best feasible CAL (the line extending from the risk-free rate and that is tangent to the opportunity set). What is the slope of the best feasible CAL? Draw the CAL. Indicate on the graph the optimal risky portfolio 'P'. (8pts) A pension fund manager is considering three mutual funds. The first is a stock fund, the second is a long-term government and corporate bond fund, and the third is a T-bill money market fund that yields a rate of 3.5%. The expected return of stock fund and bond fund are 32% and 12%, respectively. The standard deviations of stock fund and bond fund are 35% and 20% respectively. The correlation between the fund returns is 0.42. Assume you have a quadratic utility in the form of [U=E(rp)21AP2] and a risk aversion coefficient equal to 3 . Solve numerically for the proportions of each asset and for the expected return and standard deviation of the optimal risky portfolio "P" for the best feasible CAL (the line extending from the risk-free rate and that is tangent to the opportunity set). What is the slope of the best feasible CAL? Draw the CAL. Indicate on the graph the optimal risky portfolio 'P'. (8pts)
subject- investment...please draw the graph and give the explanation of the CAL
Step by Step Solution
There are 3 Steps involved in it
Step: 1

Get Instant Access to Expert-Tailored Solutions
See step-by-step solutions with expert insights and AI powered tools for academic success
Step: 2

Step: 3
Ace Your Homework with AI
Get the answers you need in no time with our AI-driven, step-by-step assistance
Get Started