Subject is Business Management
Develop a project dashboard for your team project, using Figure 6-3 as an example. Be sure to include at least eight diferent metrics. Document your results in a onc-page paper or short presentation, showing the actual dashboard you created.
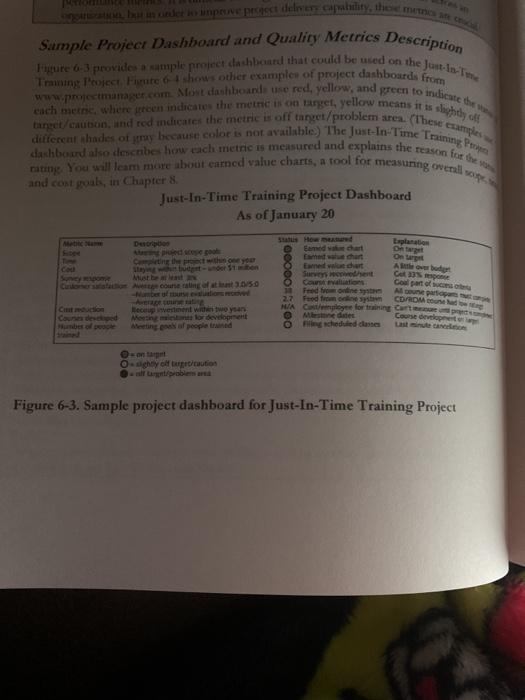
Sample Project Dashboard and Quality Metrics Description Future 6-3 provides a sample projet dashboard that could be used on the Justice www.projectmanager.com Most dashboard use red, yellow, and green to indicate the Training Project Fonte shows other examples of project dashboards from taneet eaubon Wind red indicate the metric is off tact/problem area. (These samples dashboard also describe how each menc is measured and explains the reason for the different shades of jy because color is not available. The Just In Time Training Dating You will leam more about earned value charts, a tool for measuring overall each meine, where een indicates the mette is on target, yellow means it is and cont goals, in Chapter 8 Just-In-Time Training Project Dashboard As of January 20 slightly Eand wachant M Der Ee Corting the pretthee you uptor MATE Cute counseling of at 050 Name of me Citmedim Receu nestent with two yun Counded Meeting to development Number of peace Meeting of people and Emne lucht Surveys when Coursions Fredondine 27 Feed to system MAC for training Men det Ocheduled deste Leplant DR OW Achete| Com Cool porto New CDAROMOS Course develope ont Oughoy of butto Figure 6-3. Sample project dashboard for Just-In-Time Training Project Sample Project Dashboard and Quality Metrics Description Future 6-3 provides a sample projet dashboard that could be used on the Justice www.projectmanager.com Most dashboard use red, yellow, and green to indicate the Training Project Fonte shows other examples of project dashboards from taneet eaubon Wind red indicate the metric is off tact/problem area. (These samples dashboard also describe how each menc is measured and explains the reason for the different shades of jy because color is not available. The Just In Time Training Dating You will leam more about earned value charts, a tool for measuring overall each meine, where een indicates the mette is on target, yellow means it is and cont goals, in Chapter 8 Just-In-Time Training Project Dashboard As of January 20 slightly Eand wachant M Der Ee Corting the pretthee you uptor MATE Cute counseling of at 050 Name of me Citmedim Receu nestent with two yun Counded Meeting to development Number of peace Meeting of people and Emne lucht Surveys when Coursions Fredondine 27 Feed to system MAC for training Men det Ocheduled deste Leplant DR OW Achete| Com Cool porto New CDAROMOS Course develope ont Oughoy of butto Figure 6-3. Sample project dashboard for Just-In-Time Training Project