Submission Instructions PS N97 8. 9. . Complete the exercises below, answering all questions. Submit only one Word document with all your answers labelled and
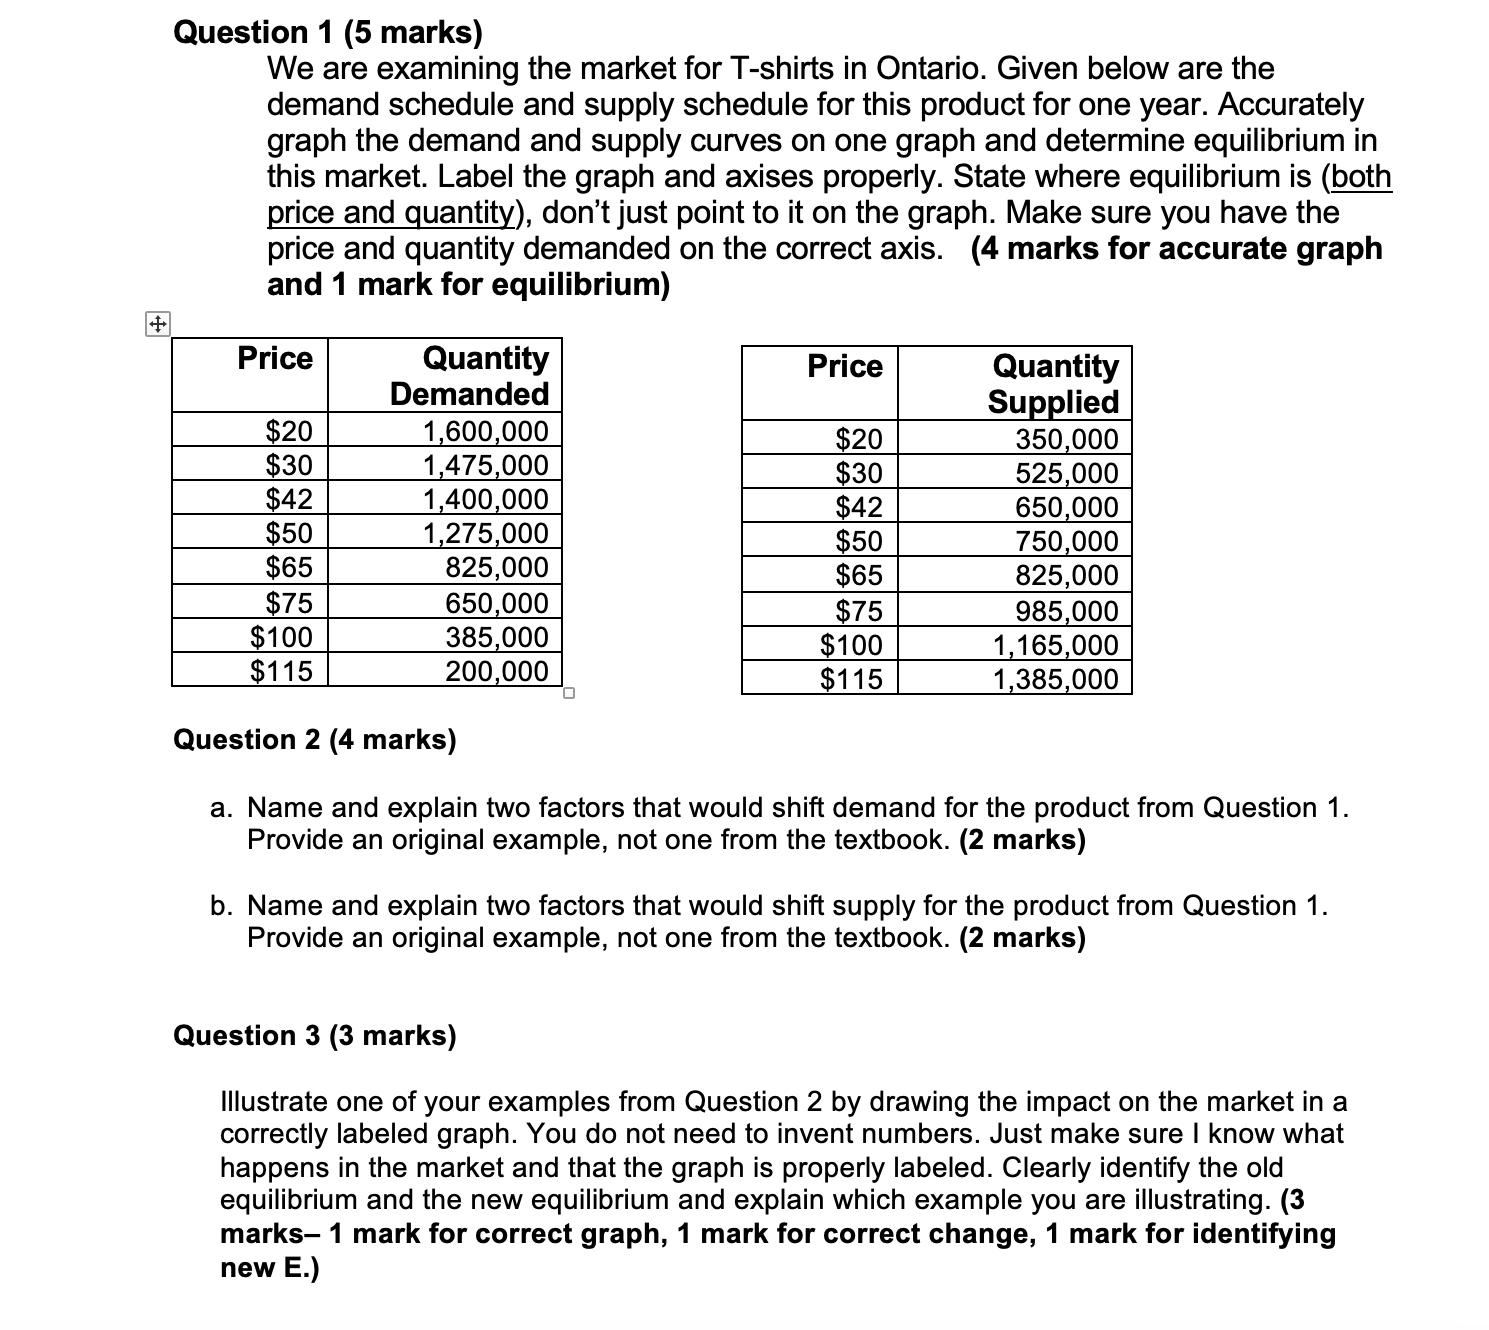
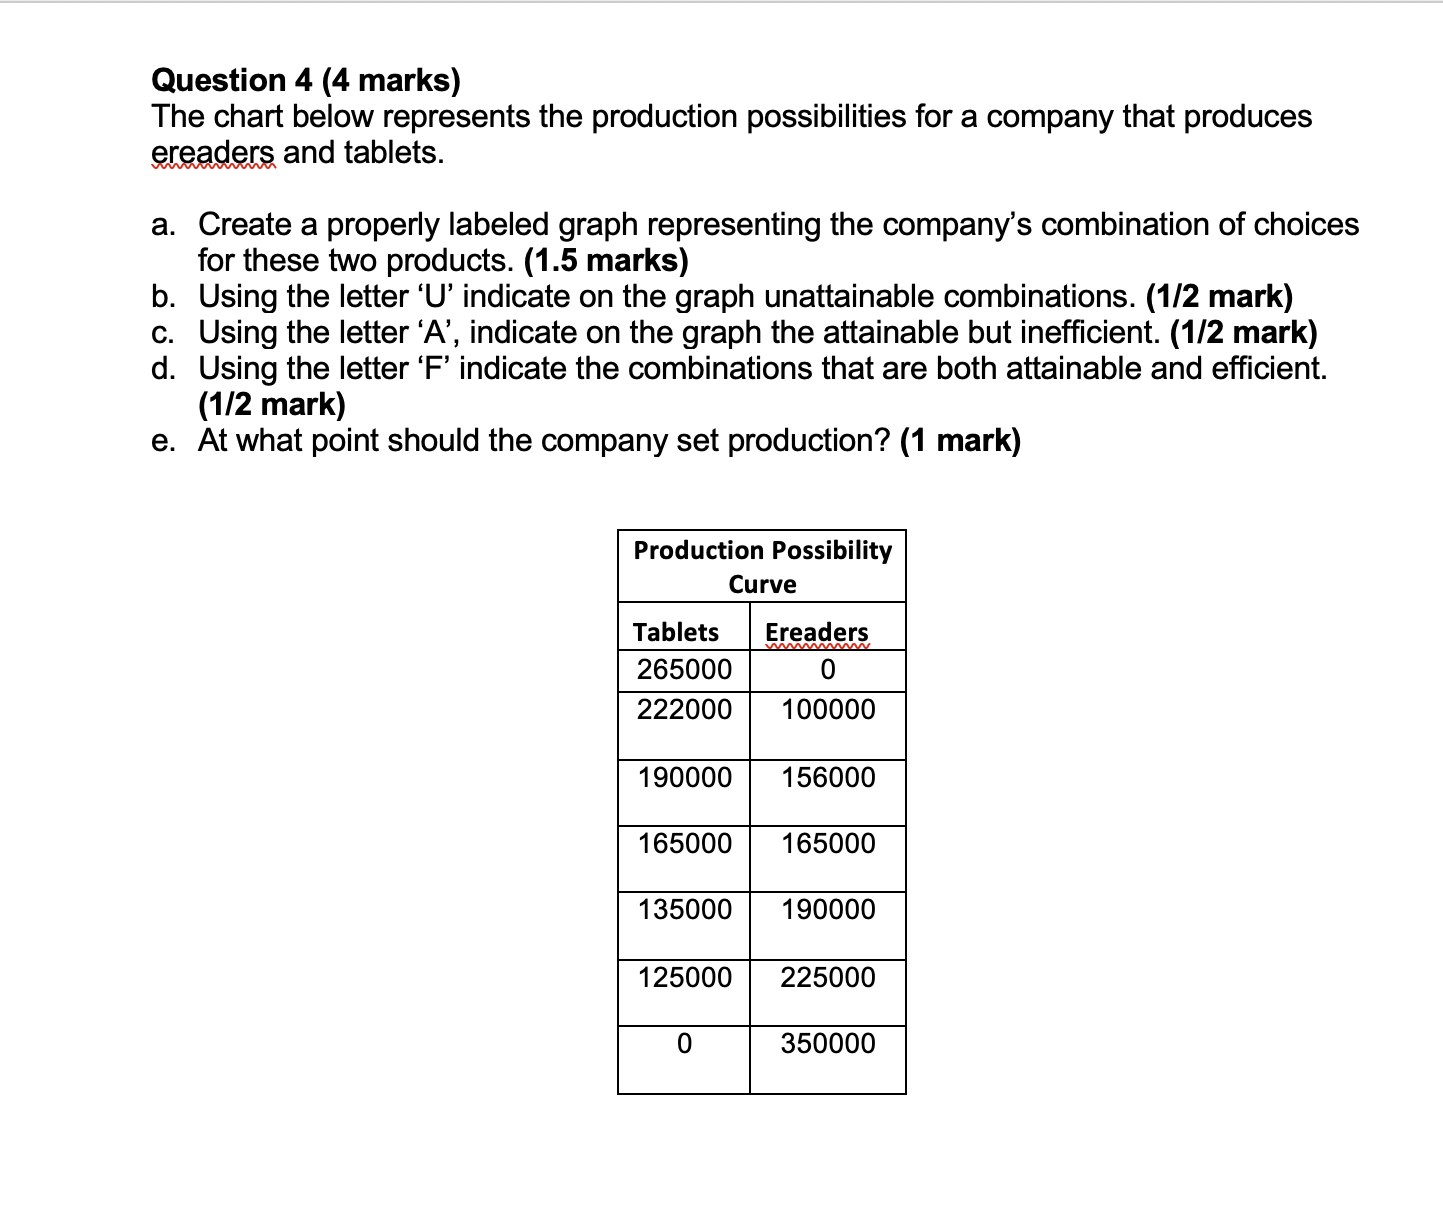
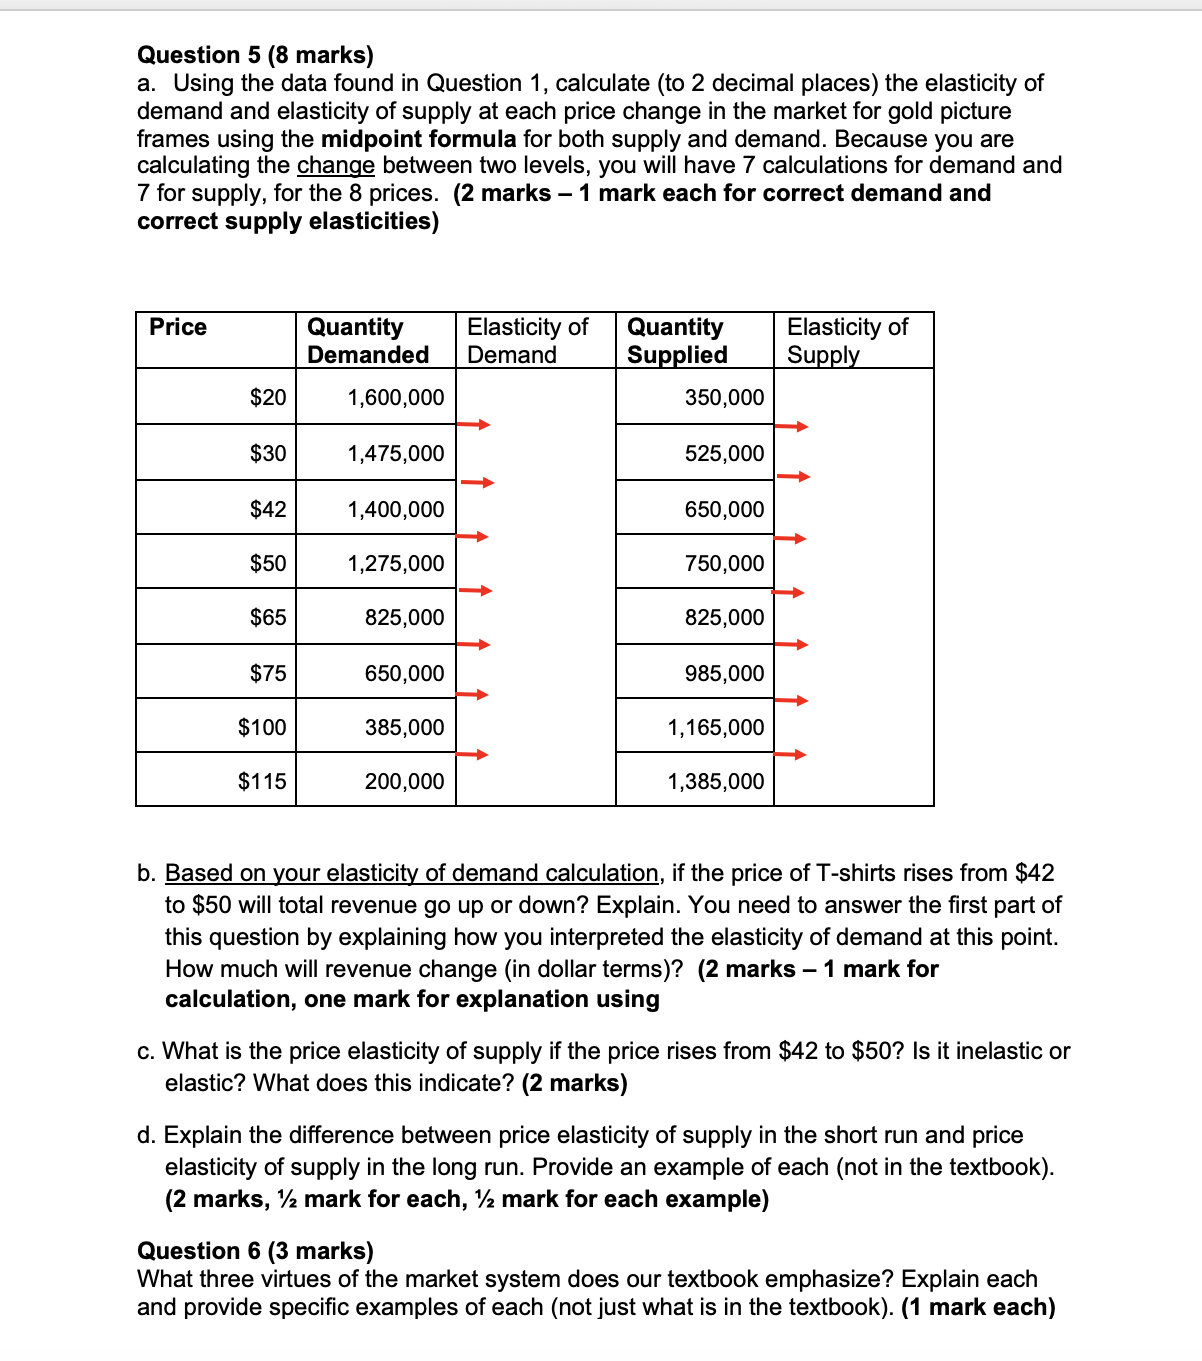
Submission Instructions PS\" N97 8. 9. . Complete the exercises below, answering all questions. Submit only one Word document with all your answers labelled and in the correct order. Do not include the questions, only your answers. Include a cover page with your name, student number, course name and assignment name. When providing references, you must cite all references using the APA format. You can nd the information for creating citations and references under Getting Started, Copyright for Students, then the Humber Libraries Website link in the course. Not identifying sources is considered academic misconduct PDF and Excel documents are not acceptable and will receive 0. Submit the assignment using the assignment submission function only. The assignment is automatically submitted to SafeAssign, which checks for plagiarism and copying. Note: You must name your file using your first name, last name, and the number of the assignment. For example, \"tom.jones1.doc\" for Tom Jones Assignment 1 Emailed assignments will not be marked. The assignment is due on the date specied on the Critical Path. Late submissions will lose 10% a day, and will not be accepted after 7 days. Marks will be deducted if you do not follow all instructions. Question 1 (5 marks) We are examining the market for T-shirts in Ontario. Given below are the demand schedule and supply schedule for this product for one year. Accurately graph the demand and supply curves on one graph and determine equilibrium in this market. Label the graph and axises properly. State where equilibrium is (m price and Quantity), don't just point to it on the graph. Make sure you have the price and quantity demanded on the correct axis. (4 marks for accurate graph and 1 mark for equilibrium) \" Su-ced 350 000 525 000 650 000 m- Demanded 1 475 000 1 400 000 .m .15.! Question 2 (4 marks) .35! .m a. Name and explain two factors that would shift demand for the product from Question 1. Provide an original example, not one from the textbook. (2 marks) b. Name and explain two factors that would shift supply for the product from Question 1. Provide an original example, not one from the textbook. (2 marks) Question 3 (3 marks) Illustrate one of your examples from Question 2 by drawing the impact on the market in a correctly labeled graph. You do not need to invent numbers. Just make sure I know what happens in the market and that the graph is properly labeled. Clearly identify the old equilibrium and the new equilibrium and explain which example you are illustrating. (3 marks 1 mark for correct graph, 1 mark for correct change, 1 mark for identifying new E.) Question 4 (4 marks) The chart below represents the production possibilities for a company that produces W and tablets. a. Create a properly labeled graph representing the company's combination of choices for these two products. (1.5 marks) b. Using the letter 'U' indicate on the graph unattainable combinations. (1I2 mark) c. Using the letter 'A', indicate on the graph the attainable but inefcient. (1I2 mark) d. Using the letter 'F' indicate the combinations that are both attainable and efcient. (112 mark) e. At what point should the company set production? (1 mark) Production Possibility Curve Tablets 265000 In 222000 100000 190000 156000 165000 165000 135000 190000 125000 225000 Question 5 (8 marks) a. Using the data found in Question 1, calculate (to 2 decimal places) the elasticity of demand and elasticity of supply at each price change in the market for gold picture frames using the midpoint formula for both supply and demand. Because you are calculating the change between two levels, you will have 7 calculations for demand and 7 for supply, for the 8 prices. (2 marks 1 mark each for correct demand and correct supply elasticities) \" Quantity Elasticity of Quantity Elasticity of Demanded Demand Su - - lied Su- -| __.. "F 1,275,000 750,000 > 825,000 825,000 650,000 985,000 $100 385,000 1,165,000 $115 200,000 1,385,000 b. Based on your elasticity of demand calculation, if the price of T-shirts rises from $42 to $50 will total revenue go up or down? Explain. You need to answer the rst part of this question by explaining how you interpreted the elasticity of demand at this point. How much will revenue change (in dollar terms)? (2 marks 1 mark for calculation, one mark for explanation using c. What is the price elasticity of supply if the price rises from $42 to $50? Is it inelastic or elastic? What does this indicate? (2 marks) d. Explain the difference between price elasticity of supply in the short run and price elasticity of supply in the long run. Provide an example of each (not in the textbook). (2 marks, Va mark for each, 1/2 mark for each example) Question 6 (3 marks) What three virtues of the market system does our textbook emphasize? Explain each and provide specic examples of each (notjust what is in the textbook). (1 mark each)
Step by Step Solution
There are 3 Steps involved in it
Step: 1
Get Instant Access to Expert-Tailored Solutions
See step-by-step solutions with expert insights and AI powered tools for academic success
Step: 2
Step: 3
Ace Your Homework with AI
Get the answers you need in no time with our AI-driven, step-by-step assistance