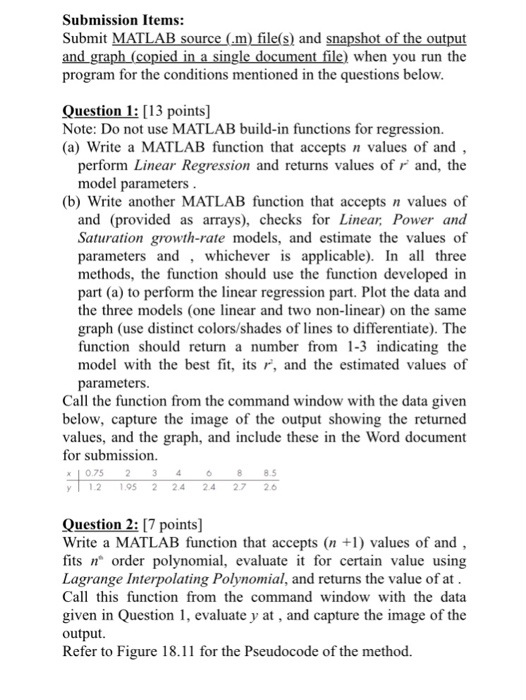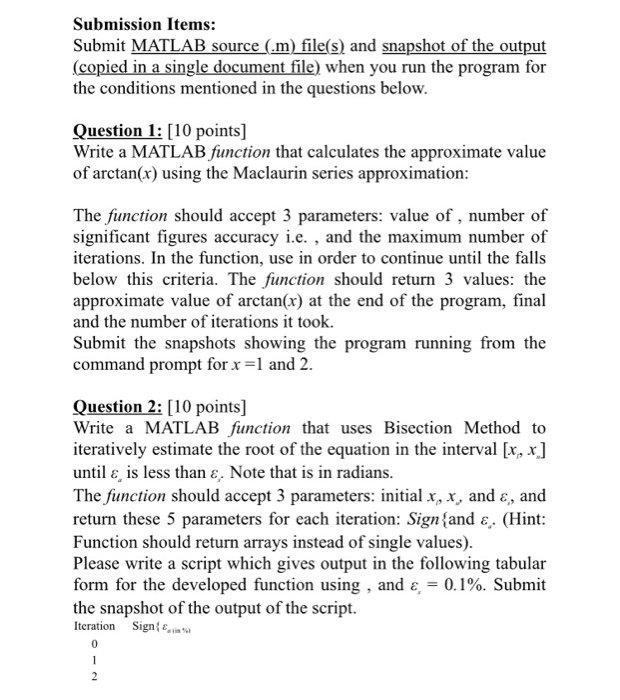
Submission Items: Submit MATLAB source (m file(s) and snapshot of the output (copied in a single document file) when you run the program for the conditions mentioned in the questions below Question 1: [10 points] Write a MATLAB function that calculates the approximate value of arctan(r) using the Maclaurin series approximation The function should accept 3 parameters: value of, number of significant figures accuracy i.e. , and the maximum number of iterations. In the function, use in order to continue until the falls below this criteria. The function should return 3 values: the approximate value of arctan(x) at the end of the program, final and the number of iterations it took Submit the snapshots showing the program running from the command prompt for x =1 and 2 Question 2: [10 points] Write a MATLAB function that uses Bisection Method to iteratively estimate the root of the equation in the interval [x, x] until , is less than &, Note that is in radians The-function should accept 3 parameters: initial x', x, and , and return these 5 parameters for each teration: Sign and . (Hint: Function should return arrays instead of single values) Please write a script which gives output in the following tabular form for the developed function using , and -0.100. Submit the snapshot of the output of the script. Iteration Signe,'" ' 0 Submission Items: Submit MATLAB source (m) file(s) and snapshot of the output and graph (copied in a single document file) when you run the program for the conditions mentioned in the questions below Question 1 [13 points] Note: Do not use MATLAB build-in functions for regression. a) Write a MATLAB function that accepts values of and perform Linear Regression and returns values of model parameters and, the (b) Write another MATLAB function that accepts values of and (provided as arrays), checks for Linear Power and Saturation growth-rate models, and estimate the values of parameters and whichever is applicable). In a three methods, the function should use the function developed in part (a) to perform the linear regression part. Plot the data and the three models (one linear and two non-linear) on the same graph (use distinct colors/shades of lines to differentiate). The function should return a number from 1-3 indicating the model with the best fit, its r, and the estimated values of parameters. Call the function from the command window with the data given below, capture the image of the output showing the returned values, and the graph, and include these in the Word document for submission. x10.75 234 y12195 2 2424 27 2 Question 2: [7 points] Write a MATLAB function that accepts (n +) values of and fits n order polynomial, evaluate it for certain value using Lagrange Interpolating Polynomial, and returns the value of at Call this function from the command window with the data given in Question 1, evaluate y at, and capture the image of the output Refer to Figure 18.11 for the Pseudocode of the method


