

Question
Submit TestingFib.java Make a program to find the run time for Fibonacci.java (GIVEN) and put your answers on an excel sheet scatter plot. Use the
Submit TestingFib.java
Make a program to find the run time for Fibonacci.java (GIVEN) and put your answers on an excel sheet scatter plot. Use the System Clock Milliseconds and find the run time for bigFastFib vs bigFib.
Are they O(N), or O(N^2), or O(2^N), or O(N^N) or O(1) or O(N!)
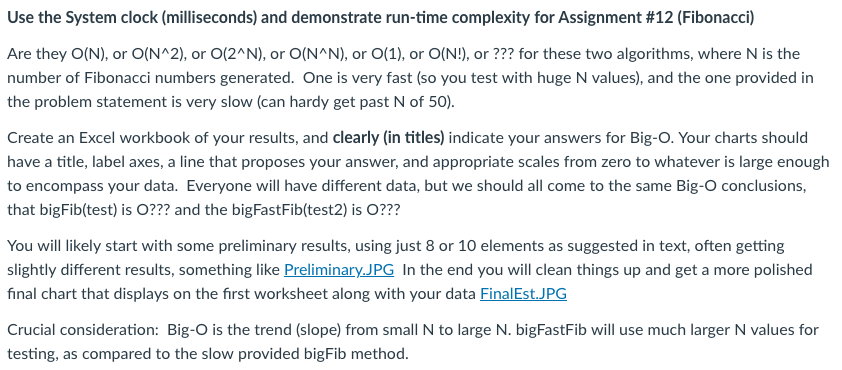
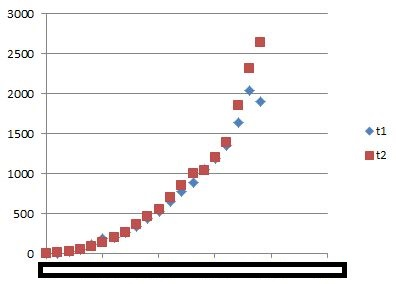
FIRST PIC: Preliminary SECOND pic: Final Est
import java.math.BigInteger; public class Fibonacci { // fields, ONE is in any version of Java already // but BigInteger.TWO requires Java 9 or higher, so I make one here private final BigInteger TWO = new BigInteger("2"); private final BigInteger ONE = new BigInteger("1"); private int n; // the boring old 32-bit limited int // only one constructor needed public Fibonacci(int number) { n = number; }
// using BigInteger // This allows us to go up to any size integer public BigInteger bigFib() { return bigFib(new BigInteger(Integer.toString(n))); } // recursive helper private BigInteger bigFib(BigInteger n) { if (n.compareTo(TWO)
//FASTER BigInteger RESURSIVE METHOD //"public bigFastFib" method public BigInteger bigFastFib() { if (n
FibDriver.java just tests a couple of Fib numbers:
import java.math.BigInteger;
public class FibDriver {
public static void main(String[] args) {
Fibonacci test = new Fibonacci(300); // Testing any number ex. 300
System.out.println(test.bigFib()); // same as above, but use BigIntegers
System.out.println(test.bigFastFib()); // same as above, but MUCH faster
}
}
Use the System clock (milliseconds) and demonstrate run-time complexity for Assignment #12 (Fibonacci) Are they O(N), or O(N 2), or O(2 N), or O(NAN), or O(1), or O(N!), or ??? for these two algorithms, where N is the number of Fibonacci numbers generated. One is very fast (so you test with huge N values), and the one provided in the problem statement is very slow (can hardy get past N of 50) Create an Excel workbook of your results, and clearly (in titles) indicate your answers for Big-O. Your charts should have a title, label axes, a line that proposes your answer, and appropriate scales from zero to whatever is large enough to encompass your data. Everyone will have different data, but we should all come to the same Big-O conclusions, that bigFib(test) is O??? and the bigFastFib(test2) is O??? You wil likely start with some preliminary results, using just 8 or 10 elements as suggested in text, often getting slightly different results, something like Preliminary JPG In the end you will clean things up and get a more polished final chart that displays on the first worksheet along with your data FinalEst JPG Crucial consideration: Big-O is the trend (slope) from small N to large N. bigFastFib will use much larger N values for testing, as compared to the slow provided bigFib method. Title here (your answer) 1400 1200 1000 800 600 400 200 0 x = (list calculation), where N = number of elementsStep by Step Solution
There are 3 Steps involved in it
Step: 1

Get Instant Access to Expert-Tailored Solutions
See step-by-step solutions with expert insights and AI powered tools for academic success
Step: 2

Step: 3
Ace Your Homework with AI
Get the answers you need in no time with our AI-driven, step-by-step assistance
Get Started
Database Design And Implementation
Authors: Edward Sciore
2nd Edition
3030338355, 978-3030338350