

Answered step by step
Verified Expert Solution
Question
1 Approved Answer
Submit your answers using the Assignment #1 Online link in Moodle A You are on the Board of Directors reviewing the performance of WestCoast Ski
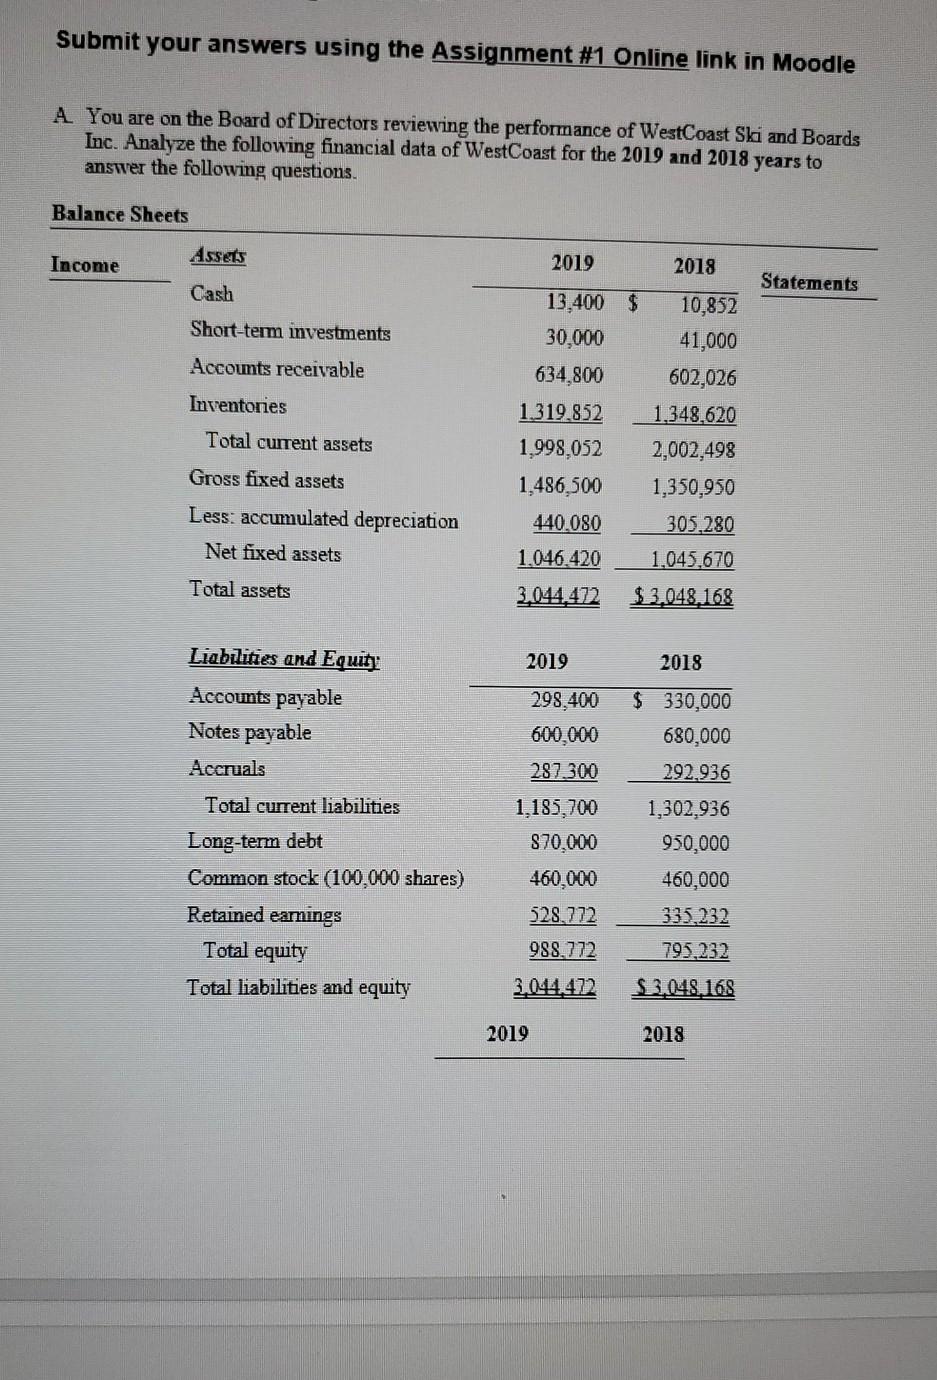
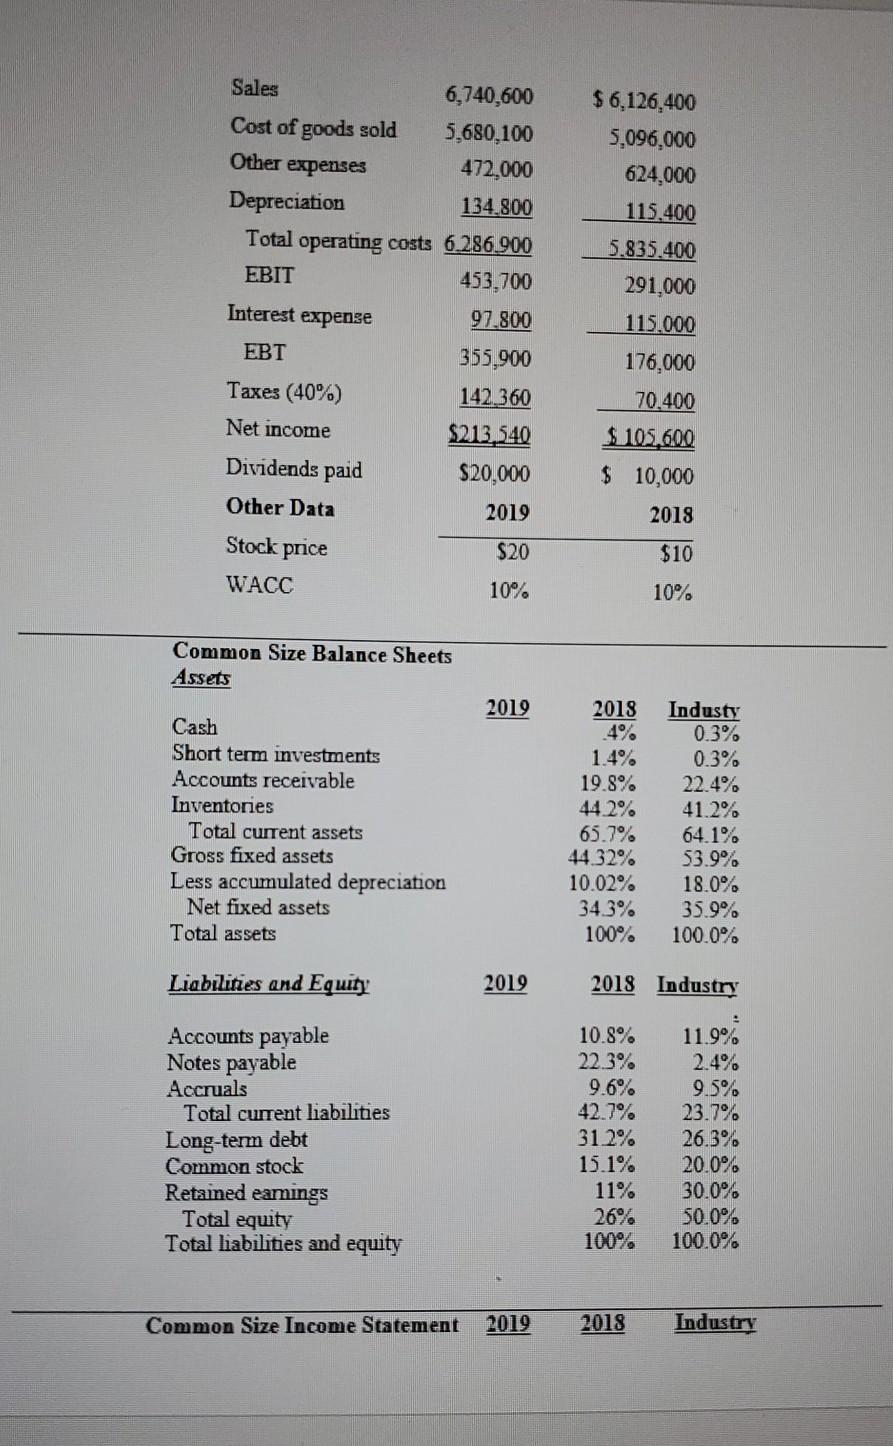
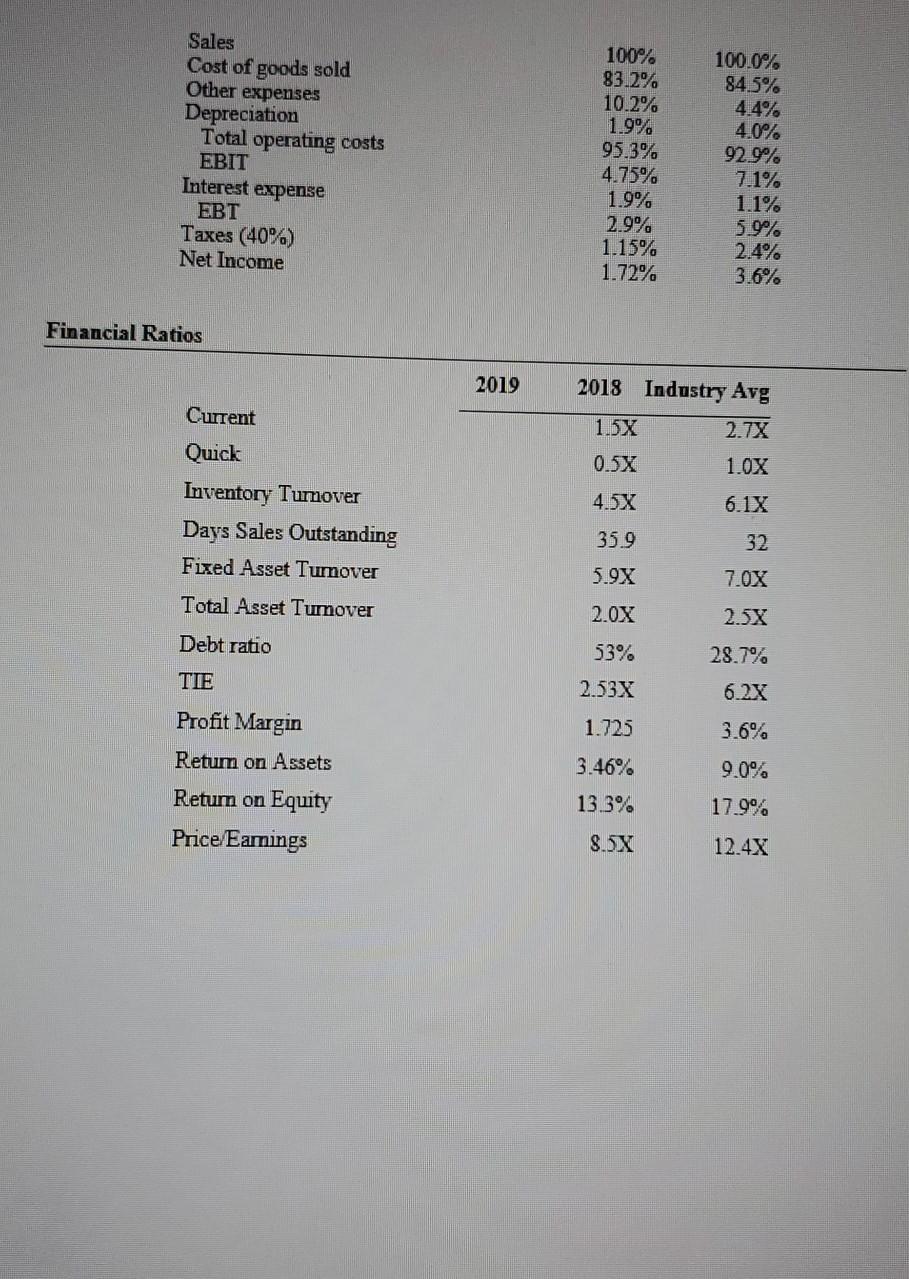
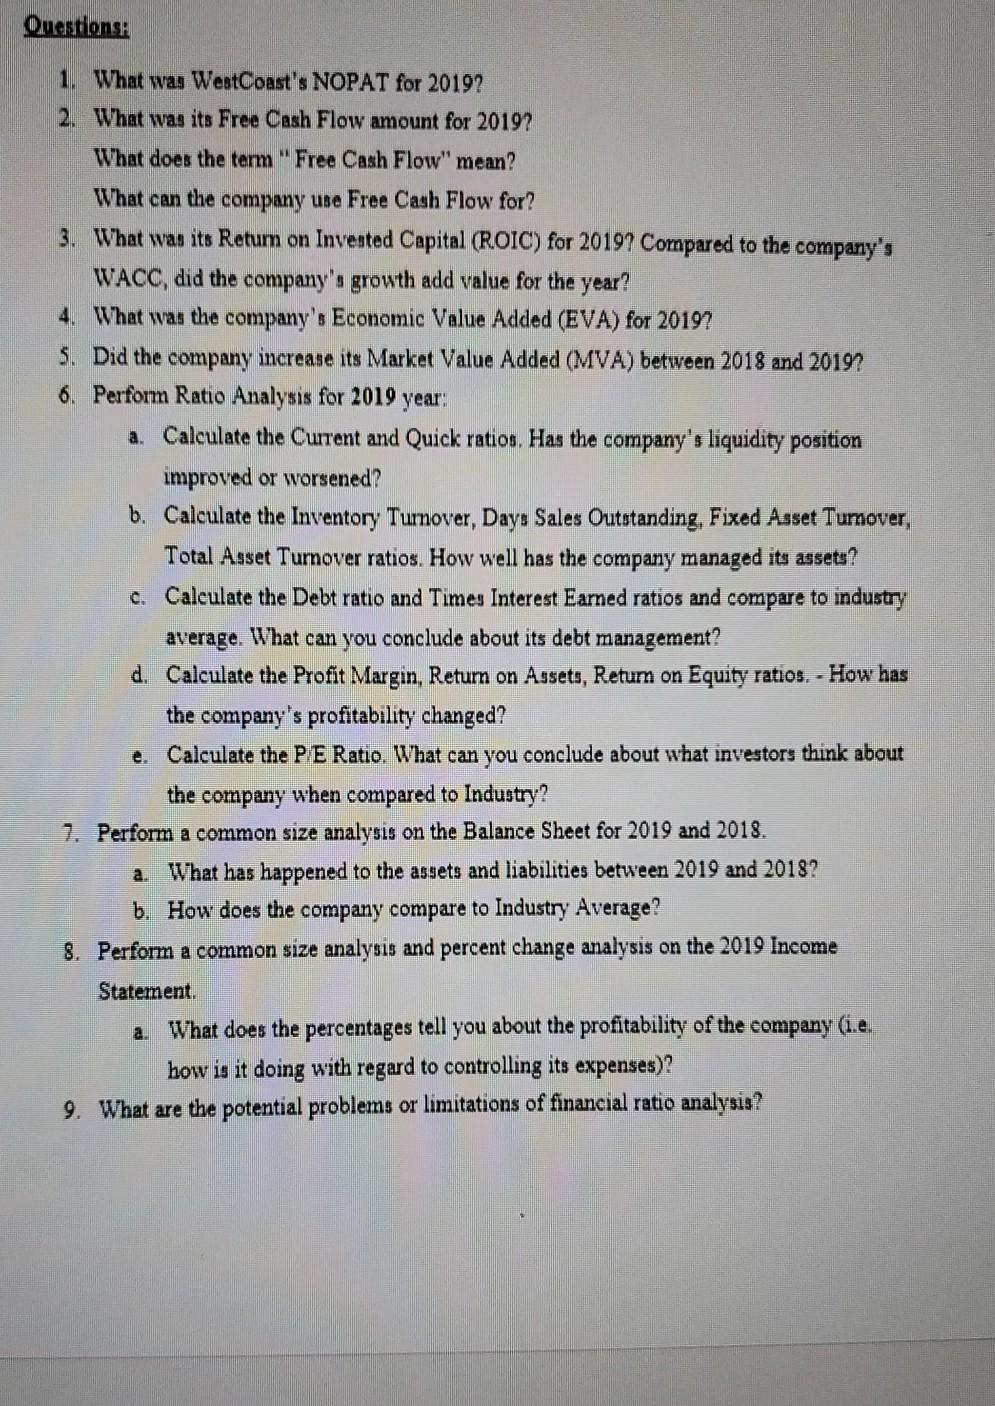
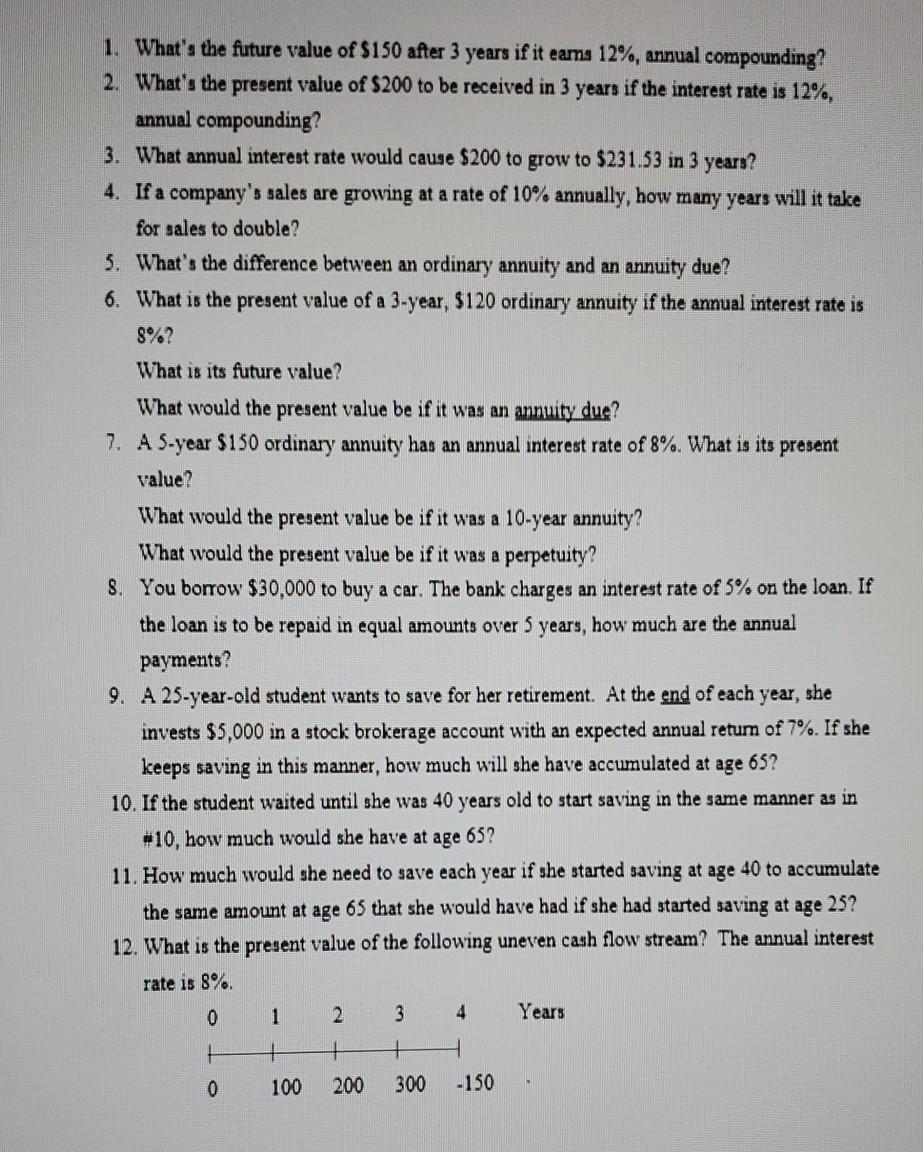
Submit your answers using the Assignment #1 Online link in Moodle A You are on the Board of Directors reviewing the performance of WestCoast Ski and Boards Inc. Analyze the following financial data of West Coast for the 2019 and 2018 years to answer the following questions. Balance Sheets Income Assets 2019 2018 Statements Cash Short-term investments Accounts receivable Inventories Total current assets 13,400 $ 10,852 30,000 41,000 634,800 602,026 1.319.852 1.348,620 1.998,052 2,002,498 1,486,500 1,350,950 440.080 305,280 1.046.420 1.045.670 3.044,472 $3,048.168 Gross fixed assets Less: accumulated depreciation Net fixed assets Total assets 2019 2018 $ 330,000 680,000 Liabilities and Equity Accounts payable Notes payable Accruals Total current liabilities Long-term debt Common stock (100,000 shares) Retained earnings Total equity Total liabilities and equity 298,400 600,000 287.300 1,185,700 870.000 460,000 528.772 988.772 292.936 1,302,936 950,000 460,000 335.232 795.232 $3.048.168 3.044.472 2019 2018 Other expenses Sales 6,740,600 Cost of goods sold 5,680,100 472,000 Depreciation 134.800 Total operating costs 6.286.900 EBIT 453.700 97.800 355,900 Taxes (40%) 142,360 Net income $213,540 Dividends paid $20,000 Other Data 2019 Interest expense $ 6,126,400 5,096,000 624,000 115.400 5.835.400 291,000 115.000 176,000 70.400 $ 105,600 $ 10,000 2018 Stock price $20 $10 WACC 10% 10% Common Size Balance Sheets Assets 2019 Cash Short term investments Accounts receivable Inventories Total current assets Gross fixed assets Less accumulated depreciation Net fixed assets Total assets 2018 4% 1.4% 19.8% 44.2% 65.7% 44.32% 10.02% 34.3% 100% Industy 0.3% 0.3% 22.4% 41.2% 64.1% 53.9% 18.0% 35.9% 100.0% Liabilities and Equity 2019 2018 Industry Accounts payable Notes payable Accruals Total current liabilities Long-term debt Common stock Retained eamings Total equity Total liabilities and equity 10.8% 22.3% 9.6% 42.7% 312% 15.1% 11% 26% 100% 11.9% 2.4% 9.5% 23.7% 26.3% 20.0% 30.0% 50.0% 100.0% Common Size Income Statement 2019 2018 Industry Sales Cost of goods sold Other expenses Depreciation Total operating costs EBIT Interest expense EBT Taxes (40%) Net Income 100% 83.2% 10.2% 1.9% 95.3% 4.75% 1.9% 2.9% 1.15% 1.72% 100.0% 84.5% 4.4% 4.0% 92.9% 7.1% 1.1% 5.9% 2.4% 3.6% Financial Ratios 2019 2018 Industry Avg 1.5% 2.7% 0.5X 1.0x 4.5X 6.1X Current Quick Inventory Tumover Days Sales Outstanding Fixed Asset Turnover Total Asset Tumover Debt ratio 32 35.9 5.9X 7.0X 2.0X 2.5X 53% 28.7% TIE 2.53X 6.2X Profit Margin 1.725 3.6% Retum on Assets 3.46% 9.0% 13.3% 17.9% Return on Equity Price Earnings 8.5X 12.4X Questions: 1. What was WestCoast's NOPAT for 2019? 2. What was its Free Cash Flow amount for 2019? What does the term Free Cash Flow" mean? What can the company use Free Cash Flow for? 3. What was its Return on Invested Capital (ROIC) for 2019? Compared to the company's WACC, did the company's growth add value for the year? 4. What was the company's Economic Value Added (EVA) for 2019? 5. Did the company increase its Market Value Added (MVA) between 2018 and 2019? 6. Perform Ratio Analysis for 2019 year: a. Calculate the Current and Quick ratios. Has the company's liquidity position improved or worsened? b. Calculate the Inventory Turnover, Day: Sales Outstanding, Fixed Asset Turnover, Total Asset Turnover ratios. How well has the company managed its assets? c. Calculate the Debt ratio and Times Interest Earned ratios and compare to industry average. What can you conclude about its debt management? d. Calculate the Profit Margin, Return on Assets, Return on Equity ratios. - How has the company's profitability changed? e. Calculate the P/E Ratio. What can you conclude about what investors think about the company when compared to Industry? 7. Perform a common size analysis on the Balance Sheet for 2019 and 2018. a. What has happened to the assets and liabilities between 2019 and 2018? b. How does the company compare to Industry Average? 8. Perform a common size analysis and percent change analysis on the 2019 Income Statement a. What does the percentages tell you about the profitability of the company (i.e. how is it doing with regard to controlling its expenses)? 9. What are the potential problems or limitations of financial ratio analysis? 1. What's the future value of $150 after 3 years if it eams 12%, annual compounding? 2. What's the present value of $200 to be received in 3 years if the interest rate is 12%, annual compounding? 3. What annual interest rate would cause $200 to grow to $231.53 in 3 years? 4. If a company's sales are growing at a rate of 10% annually, how many years will it take for sales to double? 5. What's the difference between an ordinary annuity and an annuity due? 6. What is the present value of a 3-year, $120 ordinary annuity if the annual interest rate is 8%? What is its future value? What would the present value be if it was an annuity dus? 7. A 5-year $150 ordinary annuity has an annual interest rate of 8%. What is its present value? What would the present value be if it was a 10-year annuity? What would the present value be if it was a perpetuity? 8. You borrow $30,000 to buy a car. The bank charges an interest rate of 5% on the loan. If the loan is to be repaid in equal amounts over 5 years, how much are the annual payments? 9. A 25-year-old student wants to save for her retirement. At the end of each year, she invests $5,000 in a stock brokerage account with an expected annual retum of 7%. If she keeps saving in this manner, how much will she have accumulated at age 63? 10. If the student waited until she was 40 years old to start saving in the same manner as in #10, how much would she have at age 652 11. How much would she need to save each year if she started saving at age 40 to accumulate the same amount at age 65 that she would have had if she had started saving at age 25? 12. What is the present value of the following uneven cash flow stream? The annual interest rate is 8%. 0 1 2 3 Years 4 + + 300 0 100 200 - 150 Submit your answers using the Assignment #1 Online link in Moodle A You are on the Board of Directors reviewing the performance of WestCoast Ski and Boards Inc. Analyze the following financial data of West Coast for the 2019 and 2018 years to answer the following questions. Balance Sheets Income Assets 2019 2018 Statements Cash Short-term investments Accounts receivable Inventories Total current assets 13,400 $ 10,852 30,000 41,000 634,800 602,026 1.319.852 1.348,620 1.998,052 2,002,498 1,486,500 1,350,950 440.080 305,280 1.046.420 1.045.670 3.044,472 $3,048.168 Gross fixed assets Less: accumulated depreciation Net fixed assets Total assets 2019 2018 $ 330,000 680,000 Liabilities and Equity Accounts payable Notes payable Accruals Total current liabilities Long-term debt Common stock (100,000 shares) Retained earnings Total equity Total liabilities and equity 298,400 600,000 287.300 1,185,700 870.000 460,000 528.772 988.772 292.936 1,302,936 950,000 460,000 335.232 795.232 $3.048.168 3.044.472 2019 2018 Other expenses Sales 6,740,600 Cost of goods sold 5,680,100 472,000 Depreciation 134.800 Total operating costs 6.286.900 EBIT 453.700 97.800 355,900 Taxes (40%) 142,360 Net income $213,540 Dividends paid $20,000 Other Data 2019 Interest expense $ 6,126,400 5,096,000 624,000 115.400 5.835.400 291,000 115.000 176,000 70.400 $ 105,600 $ 10,000 2018 Stock price $20 $10 WACC 10% 10% Common Size Balance Sheets Assets 2019 Cash Short term investments Accounts receivable Inventories Total current assets Gross fixed assets Less accumulated depreciation Net fixed assets Total assets 2018 4% 1.4% 19.8% 44.2% 65.7% 44.32% 10.02% 34.3% 100% Industy 0.3% 0.3% 22.4% 41.2% 64.1% 53.9% 18.0% 35.9% 100.0% Liabilities and Equity 2019 2018 Industry Accounts payable Notes payable Accruals Total current liabilities Long-term debt Common stock Retained eamings Total equity Total liabilities and equity 10.8% 22.3% 9.6% 42.7% 312% 15.1% 11% 26% 100% 11.9% 2.4% 9.5% 23.7% 26.3% 20.0% 30.0% 50.0% 100.0% Common Size Income Statement 2019 2018 Industry Sales Cost of goods sold Other expenses Depreciation Total operating costs EBIT Interest expense EBT Taxes (40%) Net Income 100% 83.2% 10.2% 1.9% 95.3% 4.75% 1.9% 2.9% 1.15% 1.72% 100.0% 84.5% 4.4% 4.0% 92.9% 7.1% 1.1% 5.9% 2.4% 3.6% Financial Ratios 2019 2018 Industry Avg 1.5% 2.7% 0.5X 1.0x 4.5X 6.1X Current Quick Inventory Tumover Days Sales Outstanding Fixed Asset Turnover Total Asset Tumover Debt ratio 32 35.9 5.9X 7.0X 2.0X 2.5X 53% 28.7% TIE 2.53X 6.2X Profit Margin 1.725 3.6% Retum on Assets 3.46% 9.0% 13.3% 17.9% Return on Equity Price Earnings 8.5X 12.4X Questions: 1. What was WestCoast's NOPAT for 2019? 2. What was its Free Cash Flow amount for 2019? What does the term Free Cash Flow" mean? What can the company use Free Cash Flow for? 3. What was its Return on Invested Capital (ROIC) for 2019? Compared to the company's WACC, did the company's growth add value for the year? 4. What was the company's Economic Value Added (EVA) for 2019? 5. Did the company increase its Market Value Added (MVA) between 2018 and 2019? 6. Perform Ratio Analysis for 2019 year: a. Calculate the Current and Quick ratios. Has the company's liquidity position improved or worsened? b. Calculate the Inventory Turnover, Day: Sales Outstanding, Fixed Asset Turnover, Total Asset Turnover ratios. How well has the company managed its assets? c. Calculate the Debt ratio and Times Interest Earned ratios and compare to industry average. What can you conclude about its debt management? d. Calculate the Profit Margin, Return on Assets, Return on Equity ratios. - How has the company's profitability changed? e. Calculate the P/E Ratio. What can you conclude about what investors think about the company when compared to Industry? 7. Perform a common size analysis on the Balance Sheet for 2019 and 2018. a. What has happened to the assets and liabilities between 2019 and 2018? b. How does the company compare to Industry Average? 8. Perform a common size analysis and percent change analysis on the 2019 Income Statement a. What does the percentages tell you about the profitability of the company (i.e. how is it doing with regard to controlling its expenses)? 9. What are the potential problems or limitations of financial ratio analysis? 1. What's the future value of $150 after 3 years if it eams 12%, annual compounding? 2. What's the present value of $200 to be received in 3 years if the interest rate is 12%, annual compounding? 3. What annual interest rate would cause $200 to grow to $231.53 in 3 years? 4. If a company's sales are growing at a rate of 10% annually, how many years will it take for sales to double? 5. What's the difference between an ordinary annuity and an annuity due? 6. What is the present value of a 3-year, $120 ordinary annuity if the annual interest rate is 8%? What is its future value? What would the present value be if it was an annuity dus? 7. A 5-year $150 ordinary annuity has an annual interest rate of 8%. What is its present value? What would the present value be if it was a 10-year annuity? What would the present value be if it was a perpetuity? 8. You borrow $30,000 to buy a car. The bank charges an interest rate of 5% on the loan. If the loan is to be repaid in equal amounts over 5 years, how much are the annual payments? 9. A 25-year-old student wants to save for her retirement. At the end of each year, she invests $5,000 in a stock brokerage account with an expected annual retum of 7%. If she keeps saving in this manner, how much will she have accumulated at age 63? 10. If the student waited until she was 40 years old to start saving in the same manner as in #10, how much would she have at age 652 11. How much would she need to save each year if she started saving at age 40 to accumulate the same amount at age 65 that she would have had if she had started saving at age 25? 12. What is the present value of the following uneven cash flow stream? The annual interest rate is 8%. 0 1 2 3 Years 4 + + 300 0 100 200 - 150
Step by Step Solution
There are 3 Steps involved in it
Step: 1

Get Instant Access to Expert-Tailored Solutions
See step-by-step solutions with expert insights and AI powered tools for academic success
Step: 2

Step: 3
Ace Your Homework with AI
Get the answers you need in no time with our AI-driven, step-by-step assistance
Get Started
Corporate Treasury And Cash Management
Authors: Robert Cooper
1st Edition
1349512699, 9781349512690