Answered step by step
Verified Expert Solution
Link Copied!

Question

1 Approved Answer

subset of a population measure of variability used to determine how frequency table far raw scores in a data distribution lie from that distribution's mean.
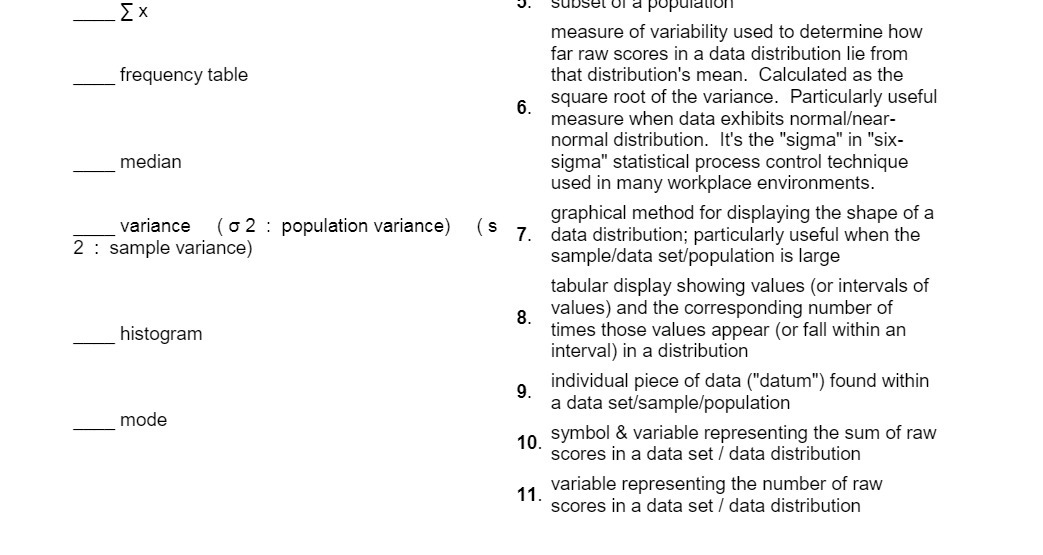
image text in transcribed
subset of a population measure of variability used to determine how frequency table far raw scores in a data distribution lie from that distribution's mean. Calculated as the 6. square root of the variance. Particularly useful measure when data exhibits normalear- normal distribution. It's the "sigma" in "six- median sigma" statistical process control technique used in many workplace environments. graphical method for displaying the shape of a 2 : sample variance) variance ( 6 2 : population variance) ($ 7. data distribution; particularly useful when the sample/data set/population is large tabular display showing values (or intervals of 8 values) and the corresponding number of histogram times those values appear (or fall within an interval) in a distribution individual piece of data ("datum") found within mode a data set/sample/population 10 symbol & variable representing the sum of raw scores in a data set / data distribution 11 variable representing the number of raw scores in a data set / data distribution

Step by Step Solution

There are 3 Steps involved in it

Step: 1

blur-text-image

Get Instant Access to Expert-Tailored Solutions

See step-by-step solutions with expert insights and AI powered tools for academic success

Step: 2

blur-text-image

Step: 3

blur-text-image

Ace Your Homework with AI

Get the answers you need in no time with our AI-driven, step-by-step assistance

Get Started

Recommended Textbook for

Finite Mathematics and Its Applications

Authors: Larry J. Goldstein, David I. Schneider, Martha J. Siegel, Steven Hair

12th edition

978-0134768588, 9780134437767, 134768582, 134437764, 978-0134768632

More Books

Students also viewed these Mathematics questions