Summary information for each study Population Study p I! Sample Scare p Tails of Test A 12 2 15 [1.115 1 {high predicted} E1 12
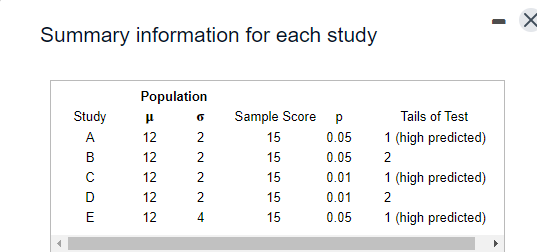
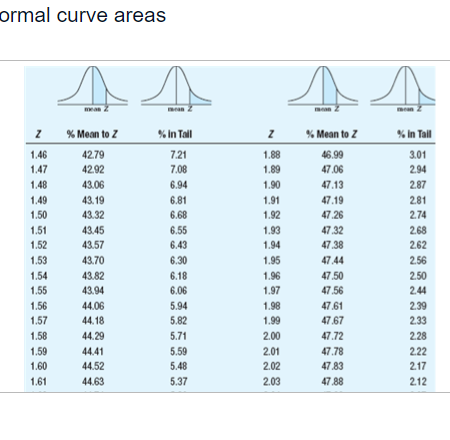
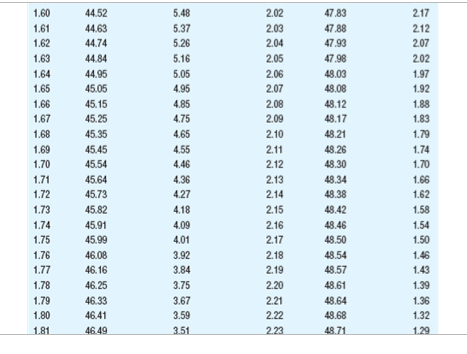
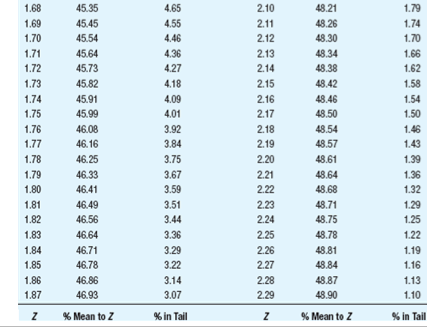
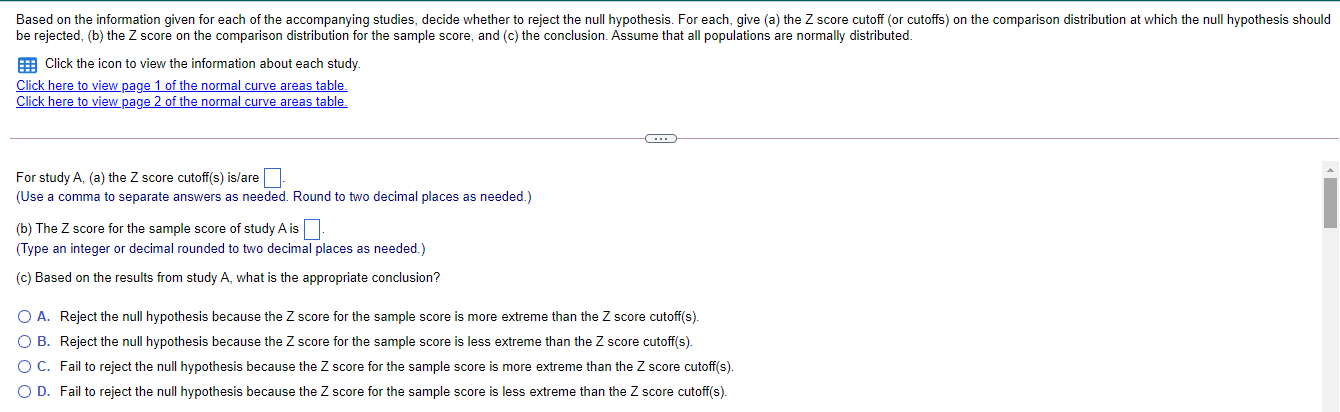
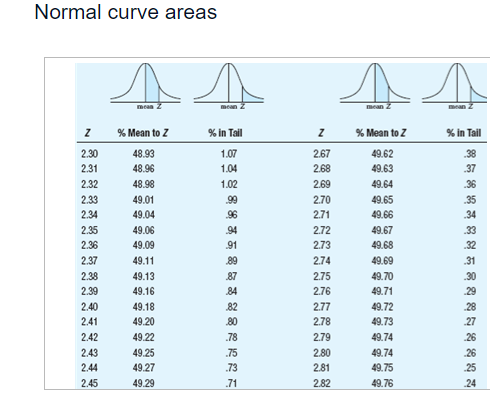
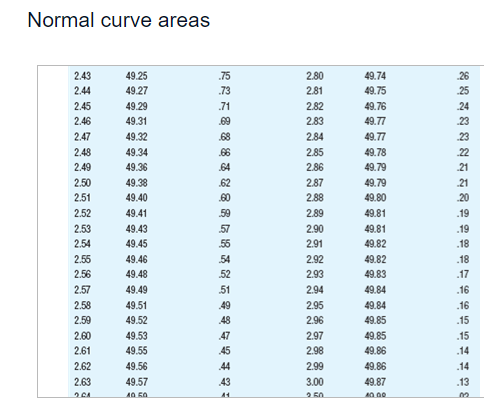
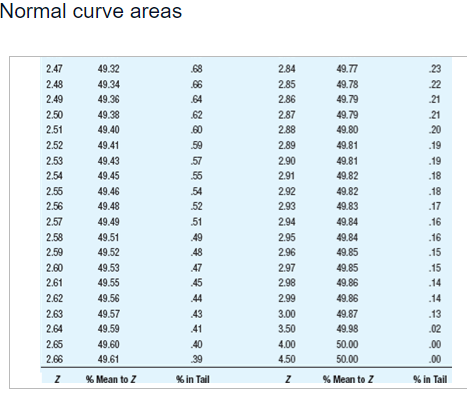
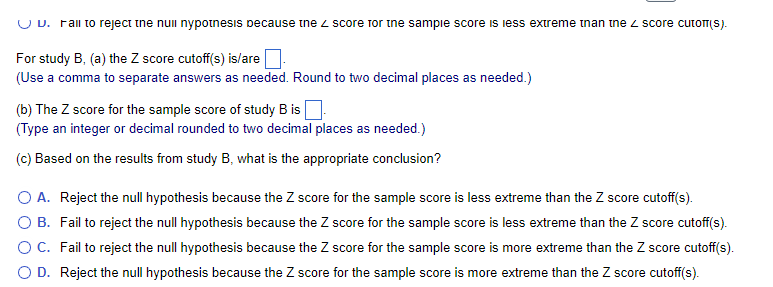
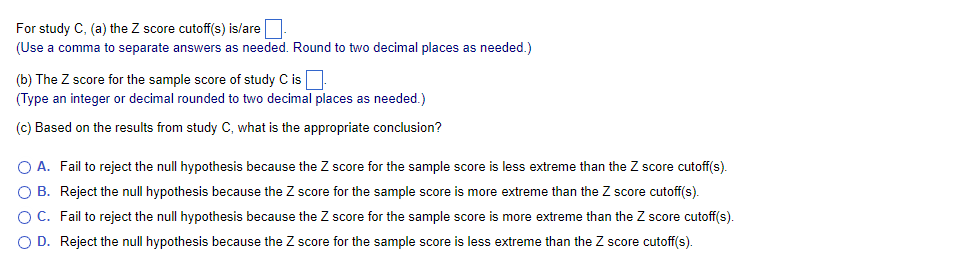
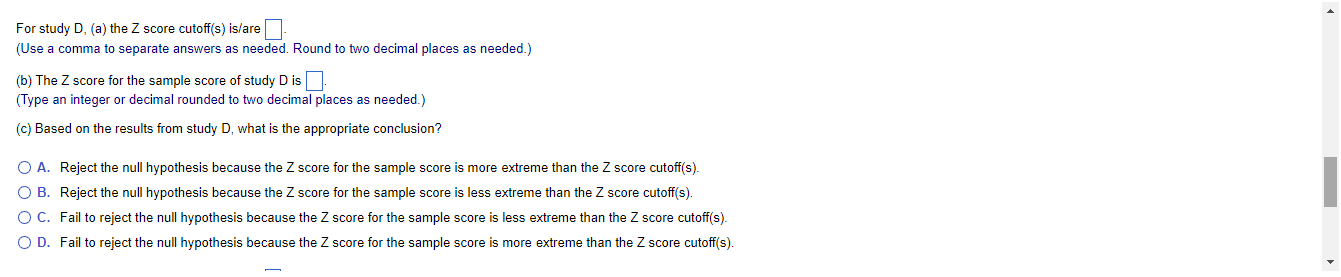
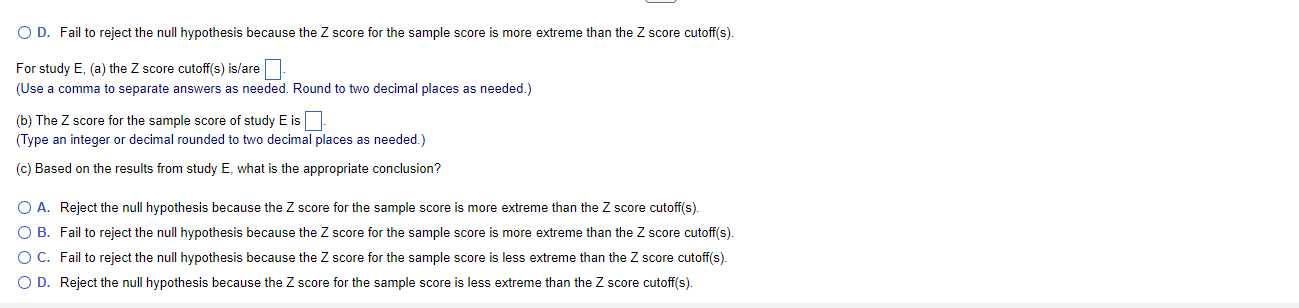
Summary information for each study Population Study p I! Sample Scare p Tails of Test A 12 2 15 [1.115 1 {high predicted} E1 12 2 15 [1.115 2 C 12 2 15 [1.111 1 {high predicted} D 12 2 15 [1.111 2 E 12 4 15 [1.115 1 {high predicted} ** ormal curve areas % Mean to Z %% In Tall % Mean to Z % In Tall 1.46 42.79 7.21 1.88 46.99 3.01 1.47 42.92 7.08 1.89 47.06 2.94 1.48 43.06 6.94 1.90 47.13 2.87 1.49 43.19 6.81 1.91 47.19 2.81 1.50 43.32 6.68 1.92 47.26 2.74 1.51 43.45 6.55 1.93 47.32 2.68 1.52 43.57 6.43 1.94 47.38 2.62 1.53 43.70 6.30 1.95 47.44 2.56 1.54 43.82 6.18 1.96 47.50 2.50 1.55 43.94 6.06 1.97 47.56 2.44 1.56 44 06 5.94 1.98 47.61 2.39 1.57 44. 18 5.82 1.99 47.67 2.33 1.58 44.29 5.71 2.00 47.72 2.28 1.59 44.41 5.59 2.01 47.78 2.22 1.60 44.52 5.48 2.02 47.83 217 1.61 44.63 5.37 2.03 47.88 2121.60 44.52 5.48 2.02 47,83 217 1.61 44.63 5.37 2.03 47.88 212 1.62 44.74 5.26 2.04 47.93 2.07 1.63 14.84 5.16 2.05 47.98 2.02 1.64 44.95 5.05 2.06 48.03 1.97 1.65 45.05 4,95 2.07 48.08 1.92 1.66 45.15 4.85 2.08 48.12 1.88 1.67 45.25 4,75 2.09 48,17 1.83 1.68 45.35 4.65 2.10 48.21 1.79 1.69 45.45 4,55 2.11 48.26 1.74 1.70 45.54 4.46 2.12 48.30 1.70 1.71 45.64 4,36 2.13 48.34 1.66 1.72 45.73 4.27 2.14 48.38 1.62 1.73 45.82 4,18 2.15 48.42 1.58 1.74 45.91 4.09 2.16 48.46 1.54 1.75 45 99 4,01 2.17 48.50 1.50 1.76 46.08 3.92 2.18 48.54 1.46 1.77 46.16 3.84 2.19 48.57 1.43 1.78 46.25 3.75 2.20 48.61 1.39 1.79 46 33 3.67 2.21 48.64 1.36 1.80 46.41 3.59 2.22 48.68 1.32 1.81 46 49 3.51 2.23 48.71 1.29\fNormal curve areas % Mean to Z % in Tail Z % Mean to Z in Tail 2.30 48.93 1.07 2.67 49.62 38 2.31 48.96 1.04 2.68 49.63 .37 2.32 48.98 1.02 2.69 49.64 36 2.33 49.01 2.70 49.65 35 2.34 49.04 .96 2.71 49.66 34 2.35 49.06 94 2.72 49.67 .33 2.36 49.09 91 2.73 49.68 2.37 49.11 89 2.74 49.69 .31 2.38 49.13 2.75 49.70 .30 2.39 49.16 84 2.76 49.71 .29 2.40 49.18 82 2.77 49.72 28 2.41 49.20 .80 2.78 49.73 27 2.42 49.22 .78 2.79 49.74 .26 2.43 49.25 .75 2.80 49.74 26 2.44 49.27 .73 2.81 49.75 .25 2.45 49.29 .71 2.82 49.76 24Normal curve areas 2.43 49.25 .75 2.80 49.74 26 2.44 49.27 .73 2.81 49.75 .25 2.45 49.29 .71 2.82 49.76 .24 2.46 49.31 69 2.83 49.77 .23 2.47 49.32 68 2.84 49.77 73 2.48 49.34 2.85 49.78 2.49 49.36 2.86 49.79 2.50 49.38 2.87 49.79 21 2.51 49.40 2.88 49.80 .20 2.52 49.41 2.89 49.81 .19 2.53 49.43 2.90 49 81 .19 2.54 49.45 2.91 49.82 .18 2.55 49.46 54 2.92 49.82 .18 2.56 49.48 52 2.93 49.83 -17 2.57 49.49 51 2.94 49.84 .16 2.58 49.51 .49 2.95 49.84 -16 2.59 49.52 48 2.96 49.85 -15 2.60 49.53 47 2.97 49.85 .15 2.61 49.55 45 2.98 49.86 -14 2.62 49.56 44 2.99 49.86 .14 2.63 49.57 43 3.00 49.87 13Normal curve areas 2.47 49.32 68 2.84 49.77 23 2.49 49.34 66 2.85 49.78 2.49 49.36 64 2.86 49.79 2.50 49.38 62 2.87 49.79 2.51 49.40 60 2.88 49.80 2.52 49.41 2.89 49.81 .19 2.53 49.43 2.90 49.81 .19 2.54 49.45 50 2.91 49.82 18 2.55 49.46 54 2.92 49.82 .18 2.56 49.48 52 2.93 49.83 -17 2.57 49.49 51 2.94 49.84 16 2.58 49.51 .49 2.95 49.84 .16 2.59 49.52 -48 2.96 49.85 -15 2.60 49.53 2.97 49.85 .15 2.61 49.55 .45 2.98 49.86 .14 2.62 49.56 44 2.99 49.86 -14 2.63 49.57 43 3.00 49.87 .13 2.64 49.59 -41 3.50 49.98 .02 2.65 49.60 40 4.00 50.00 2.66 49.61 39 4.50 50.00 00 Z % Mean to Z % In Tall Z %% Mean to Z 9% In TallBased on the information given for each of the accompanying studies, decide whether to reject the null hypothesis. For each, give (a) the Z score cutoff (or cutoffs) on the comparison distribution at which the null hypothesis should be rejected, (b) the Z score on the comparison distribution for the sample score, and (c) the conclusion. Assume that all populations are normally distributed. Click the icon to view the information about each study. Click here to view page 1 of the normal curve areas table. Click here to view page 2 of the normal curve areas table. For study A, (a) the Z score cutoff(s) is/are. (Use a comma to separate answers as needed. Round to two decimal places as needed.) (b) The Z score for the sample score of study A is]. (Type an integer or decimal rounded to two decimal places as needed.) (c) Based on the results from study A, what is the appropriate conclusion? O A. Reject the null hypothesis because the Z score for the sample score is more extreme than the Z score cutoff(s). O B. Reject the null hypothesis because the Z score for the sample score is less extreme than the Z score cutoff(s). O C. Fail to reject the null hypothesis because the Z score for the sample score is more extreme than the Z score cutoff(s). O D. Fail to reject the null hypothesis because the Z score for the sample score is less extreme than the Z score cutoff(s).( U. Fail to reject the null nypotnesis because the 2 score for ine sample score is less extreme than the _ score cutom(s). For study B, (a) the Z score cutoff(s) is/are (Use a comma to separate answers as needed. Round to two decimal places as needed.) (b) The Z score for the sample score of study B is (Type an integer or decimal rounded to two decimal places as needed.) (c) Based on the results from study B, what is the appropriate conclusion? O A. Reject the null hypothesis because the Z score for the sample score is less extreme than the Z score cutoff(s). O B. Fail to reject the null hypothesis because the Z score for the sample score is less extreme than the Z score cutoff(s). O C. Fail to reject the null hypothesis because the Z score for the sample score is more extreme than the Z score cutoff(s). O D. Reject the null hypothesis because the Z score for the sample score is more extreme than the Z score cutoff(s).For study C, (a) the Z score cutoff(s) is/are (Use a comma to separate answers as needed. Round to two decimal places as needed.) (b) The Z score for the sample score of study C is (Type an integer or decimal rounded to two decimal places as needed.) (c) Based on the results from study C, what is the appropriate conclusion? O A. Fail to reject the null hypothesis because the Z score for the sample score is less extreme than the Z score cutoff(s). O B. Reject the null hypothesis because the Z score for the sample score is more extreme than the Z score cutoff(s). O C. Fail to reject the null hypothesis because the Z score for the sample score is more extreme than the Z score cutoff(s). O D. Reject the null hypothesis because the Z score for the sample score is less extreme than the Z score cutoff(s).For study D, (a) the Z score cutoff(s) is/are (Use a comma to separate answers as needed. Round to two decimal places as needed.) (b) The Z score for the sample score of study D is |]. (Type an integer or decimal rounded to two decimal places as needed.) (c) Based on the results from study D, what is the appropriate conclusion? O A. Reject the null hypothesis because the Z score for the sample score is more extreme than the Z score cutoff(s). O B. Reject the null hypothesis because the Z score for the sample score is less extreme than the Z score cutoff(s). O C. Fail to reject the null hypothesis because the Z score for the sample score is less extreme than the Z score cutoff(s). O D. Fail to reject the null hypothesis because the Z score for the sample score is more extreme than the Z score cutoff(s).O D. Fail to reject the null hypothesis because the Z score for the sample score is more extreme than the Z score cutoff(s). For study E, (a) the Z score cutoff(s) is/are]. (Use a comma to separate answers as needed. Round to two decimal places as needed.) (b) The Z score for the sample score of study E is]. (Type an integer or decimal rounded to two decimal places as needed.) (c) Based on the results from study E, what is the appropriate conclusion? O A. Reject the null hypothesis because the Z score for the sample score is more extreme than the Z score cutoff(s). O B. Fail to reject the null hypothesis because the Z score for the sample score is more extreme than the Z score cutoff(s). O C. Fail to reject the null hypothesis because the Z score for the sample score is less extreme than the Z score cutoff(s). O D. Reject the null hypothesis because the Z score for the sample score is less extreme than the Z score cutoff(s)
Step by Step Solution
There are 3 Steps involved in it
Step: 1
Get Instant Access to Expert-Tailored Solutions
See step-by-step solutions with expert insights and AI powered tools for academic success
Step: 2
Step: 3
Ace Your Homework with AI
Get the answers you need in no time with our AI-driven, step-by-step assistance