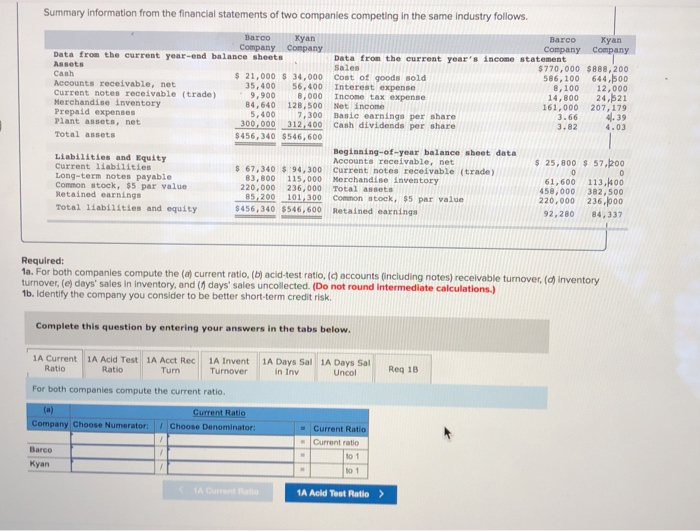
Summary Information from the financial statements of two companies competing in the same industry follows. Barco Kyan Barco Kyan Company Company Company Company Data from the current year-end balance sheets Data from the current year's income statement Assets Sales $770,000 $888,200 Cash $ 21.000 $ 34,000 cost of goods sold 586,100 644.500 Accounts receivable, net 35,400 56,400 Interest expense 8,100 12,000 Current notes receivable (trade) 9.900 8.000 Income tax expense 14,800 24,521 Merchandise Inventory 84,640 128,500 Net income 161,000 207, 179 Prepaid expenses 5,400 7,300 Basic earnings per share 3.66 4.39 Plant annets, net 300,000 312,400 Cash dividends per share 3.82 4.03 Total assets $ 456,340 $546,600 Beginning-of-year balance sheet data Liabilities and Equity Accounts receivable, net $ 25,800 $ 57,200 Current liabilities $ 67,340 $ 94, 300 Current notes receivable (trade) Long-term notes payable 83,800 115,000 Merchandise inventory 61,600 113,400 Common stock, $5 par value 220.000 236.000 Total asets 458.000 382.500 Retained earnings 85,200 101,300 Common stock, $5 par value 220,000 236,000 Total liabilities and equity $456,340 $546,600 Retained earnings 92,280 84,337 Required: 1a. For both companies compute the (a) current ratio, (b) acid-test ratio, ( accounts (including notes) receivable turnover. (d) Inventory turnover, (e) days' sales In Inventory, and (1 days' sales uncollected. (Do not round Intermediate calculations.) 1b. Identify the company you consider to be better short-term credit risk. Complete this question by entering your answers in the tabs below. 1A Current 1A Acid Test 1A Acct Rec Ratio Ratio Turn 1A Invent 1A Days Sal 1A Days Sal Turnover in Iny Uncol Reg 13 For both companies compute the current ratio. (a) Company Choose Numerator: Current Ratio Choose Denominator - Current Ratio Kyan 1A Aold Test Ratio >