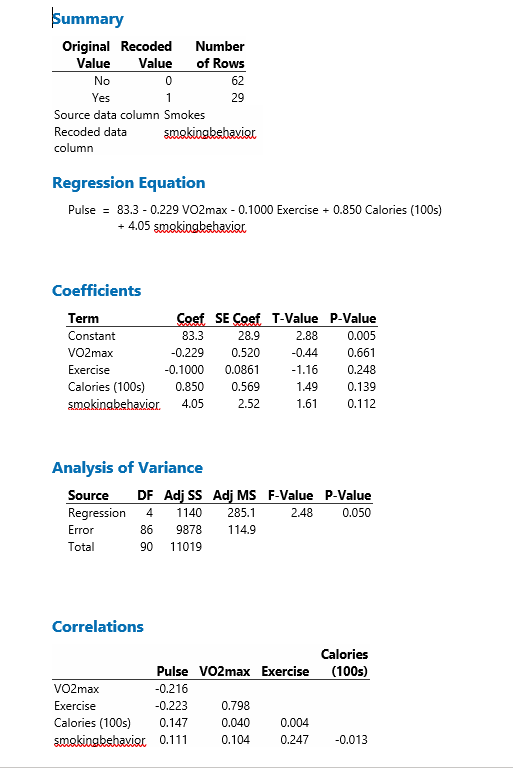
Summary Original Recoded Number Value Value of Rows No 0 62 Yes 29 Source data column Smokes Recoded data smokingbehavior column Regression Equation Pulse = 83.3 - 0.229 VO2max - 0.1000 Exercise + 0.850 Calories (100s) + 4.05 smokingbehavior Coefficients Term Coef SE Coef T-Value P-Value Constant 83.3 28.9 2.88 0.005 VO2max -0.229 0.520 -0.44 0.661 Exercise -0.1000 0.0861 -1.16 0.248 Calories (1005) 0.850 0.569 1.49 0.139 smokingbehavior 4.05 2.52 1.61 0.112 Analysis of Variance Source DF Adj SS Adj MS F-Value P-Value Regression 4 1140 285.1 2.48 0.050 Error 36 9878 114.9 Total 90 11019 Correlations Calories Pulse VO2max Exercise (1005) VO2max -0.216 Exercise -0.223 0.798 Calories (100s) 0.147 0.040 0.004 smokingbehavior 0.111 0.104 0.247 -0.013The PulseRate. MTW worksheet contains information on average pulse rate, 'vl'I'JZmax, weekly exercise minutes, daily calories consumed [in lsl, and smoking behavior for a sample of 91 individuals. [Note: 'v'DzmaI-I Is a measure of your exercise fitness. Higher 'v'DEmaI-I levels usually indicate an individual is more t.] ASSUME 11:.10 FOR THIS PROBLEM! hand, but given that there are '31 people In your dataset, you should let I'vlinitab do this for you. To get l'vlinitab to create your dummy variable: Click on Data in the top menu, select Flecode, and then choose To Numeric You will need to change me'd'Iod of recoding, default values, and where you want the new variable stored. See 'd'Ie "dumn_ly variable" screenshot attached to le Blackboard - nment for details on that. You should end up with 29 smokers and 52 nonsmokers. b} Run a regression model to estimate pulse rate [yvariable] based on 'vI'DZmax, exercise minutes, calories, and whe'd'Ier an individual smokes {Itvariables}. In general, is the overall model signicant [use the pvalue from the ANDVA table in the HTS output for this}? What about the individual xvariables (HOE, exercise, calories, and smoker]? You will use the pvalues associated with each xvariable in the "Coefficients" table in the M113 output to do that. Remember that o=.1 FDR All. TESTS IN THIS PROBLEM and remember to click on "Results" and change le \"Display of results" option to "Basic tables\". In plain, simple language, what have you learned about pulse rates from this model? Are you surprised? Explain. c] Generate a oorrelation matrix (Stat, Basic Statistics, Correlation} using all the variables in your model. I recommend you put Pulse in rst and then all your III-variables. Do you see any signs of potential multioollinearity in the table? Discussf'explain what you should you do in resgo nse