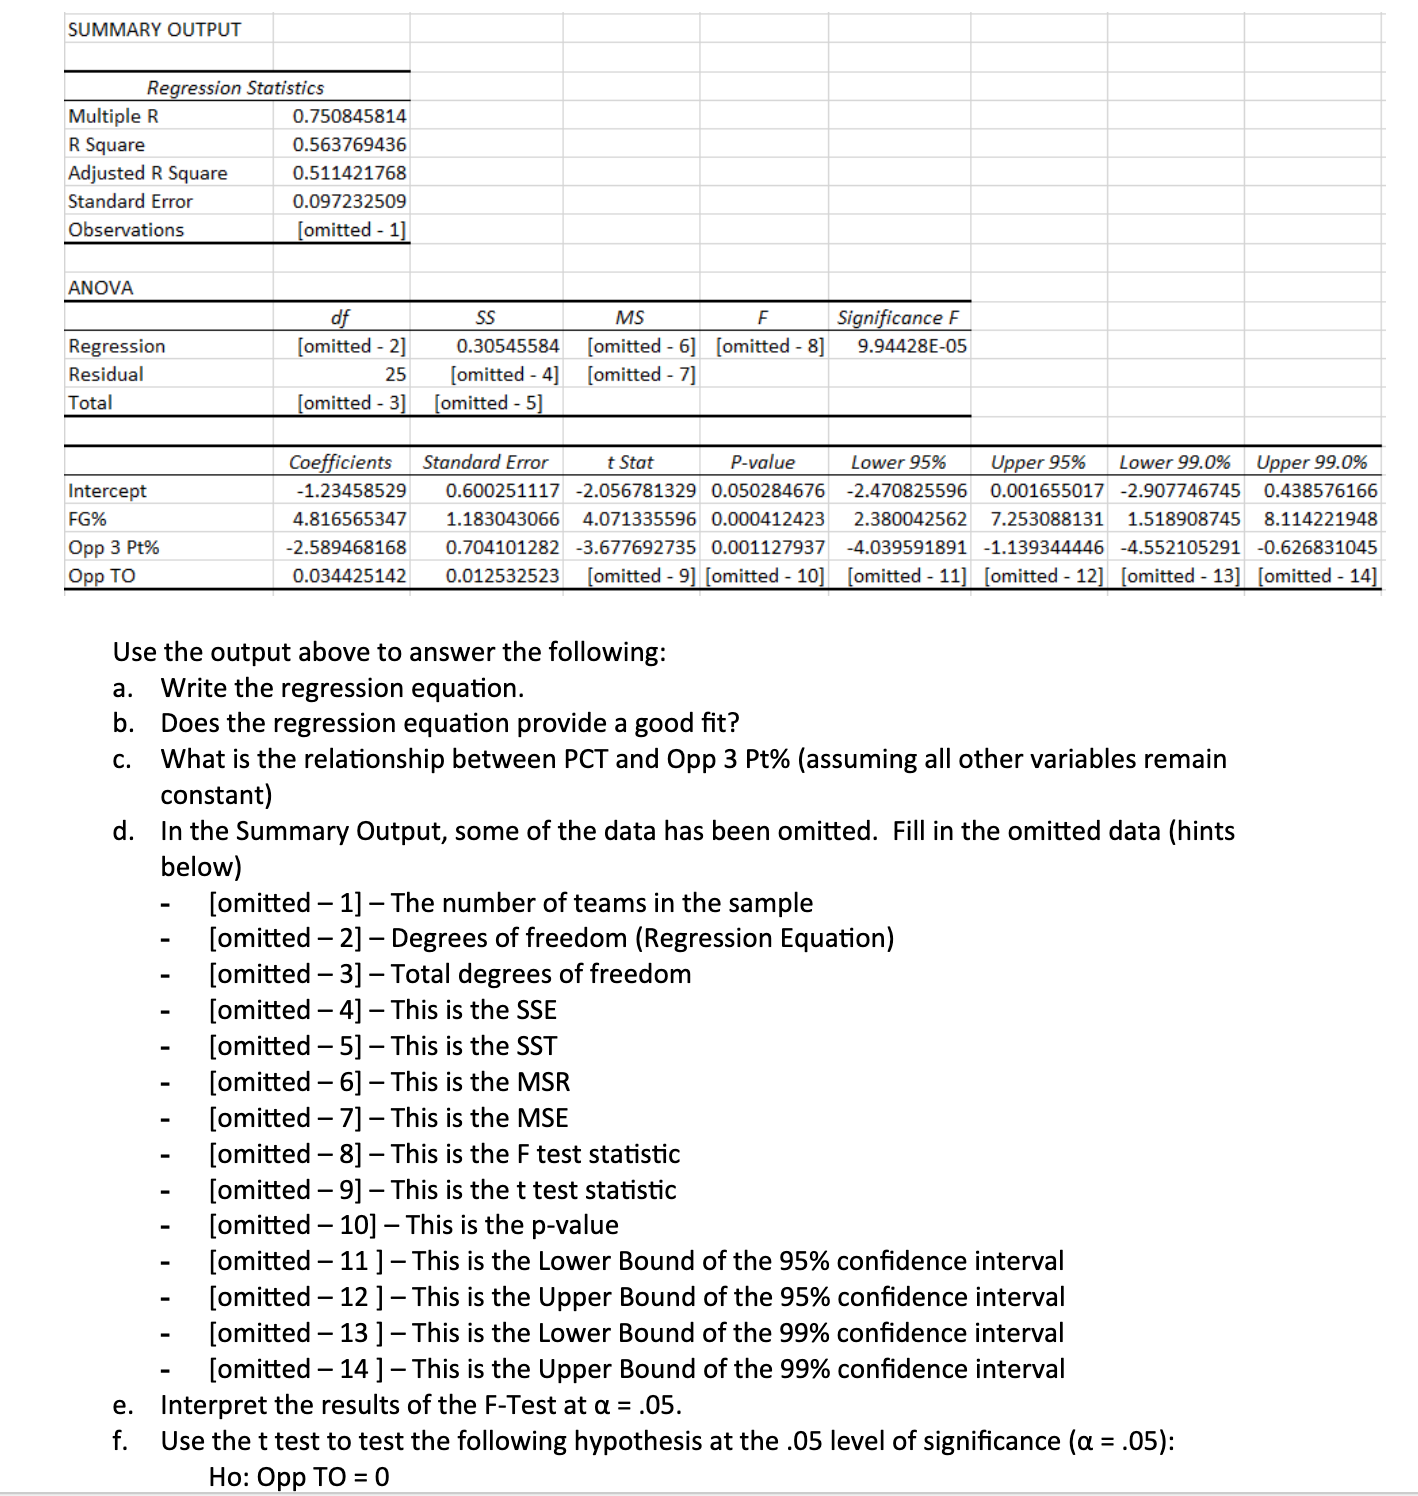
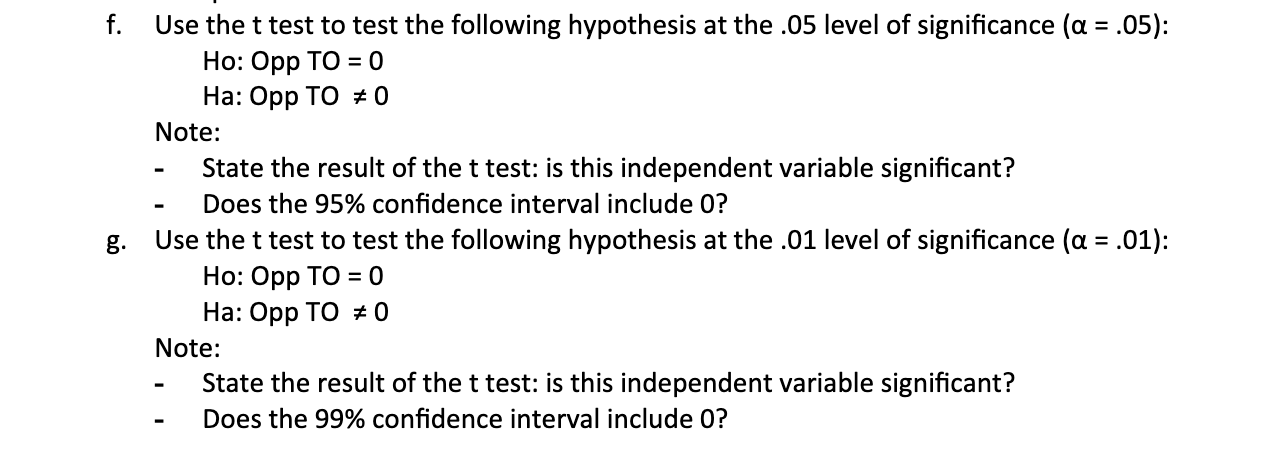
SUMMARY OUTPUT Regression Statistics Multiple R 0.750845814 R Square 0.563769436 Adjusted R Square 0.511421768 Standard Error 0.097232509 Observations [omitted - 1] ANOVA df SS MS F Significance F Regression [omitted - 2] 0.30545584 [omitted - 6] [omitted - 8] 9.94428E-05 Residual 25 [omitted - 4] [omitted - 7] Total [omitted - 3] [omitted - 5] Coefficients Standard Error t Stat P-value Lower 95% Upper 95% Lower 99.0% Upper 99.0% Intercept -1.23458529 0.600251117 -2.056781329 0.050284676 -2.470825596 0.001655017 -2.907746745 0.438576166 FG% 4.816565347 1.183043066 4.071335596 0.000412423 2.380042562 7.253088131 1.518908745 8.114221948 Opp 3 Pt% 2.589468168 0.704101282 -3.677692735 0.001127937 -4.039591891 -1.139344446 -4.552105291 -0.626831045 Opp TO 0.034425142 0.012532523 [omitted - 9] [omitted - 10] [omitted - 11] [omitted - 12] [omitted - 13] [omitted - 14] Use the output above to answer the following: a. Write the regression equation. b. Does the regression equation provide a good fit? c. What is the relationship between PCT and Opp 3 Pt% (assuming all other variables remain constant . In the Summary Output, some of the data has been omitted. Fill in the omitted data (hints below) [omitted - 1] - The number of teams in the sample [omitted - 2] - Degrees of freedom (Regression Equation) [omitted - 3] - Total degrees of freedom [omitted - 4] - This is the SSE [omitted - 5] - This is the SST [omitted - 6] - This is the MSR [omitted - 7] - This is the MSE [omitted - 8] - This is the F test statistic [omitted - 9] - This is the t test statistic [omitted - 10] - This is the p-value [omitted - 11 ] - This is the Lower Bound of the 95% confidence interval [omitted - 12 ] - This is the Upper Bound of the 95% confidence interval [omitted - 13 ] - This is the Lower Bound of the 99% confidence interval [omitted - 14 ] - This is the Upper Bound of the 99% confidence interval e. Interpret the results of the F-Test at a = .05. f . Use the t test to test the following hypothesis at the .05 level of significance (a = .05): Ho: Opp TO = 0f. Use the t test to test the following hypothesis at the .05 level of significance (a = .05): Ho: Opp TO = 0 Ha: Opp TO # 0 Note: - State the result of the t test: is this independent variable significant? - Does the 95% confidence interval include 0? g. Use the t test to test the following hypothesis at the .01 level of significance (a = .01): Ho: Opp TO = 0 Ha: Opp TO # 0 Note: - State the result of the t test: is this independent variable significant? - Does the 99% confidence interval include 0?4. What is the relationship between SST, SSR, and SSE? What is the implication if the coefficient of determination is 1


