Sun Microsystems: - Calculate the discount rate, estimate future cash flows, and then use the discounted cash flow method and multiples to value Sun Microsystems. - How much should Oracle pay for Sun Microsystems? Why
(Based on information provided below)
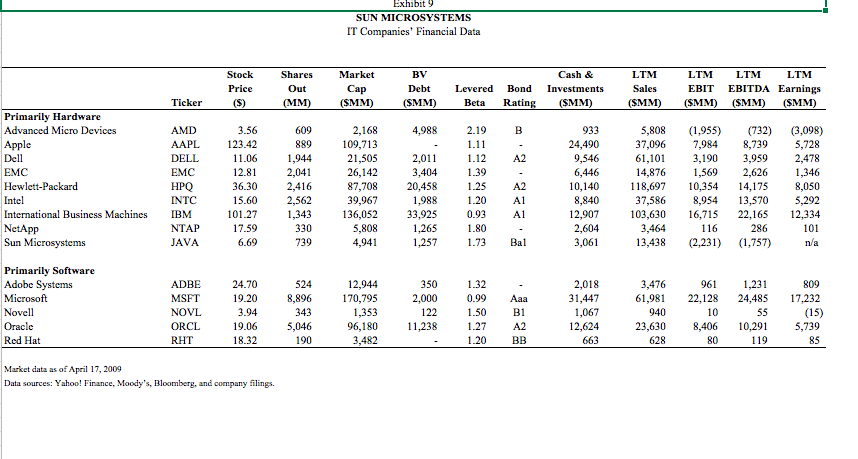
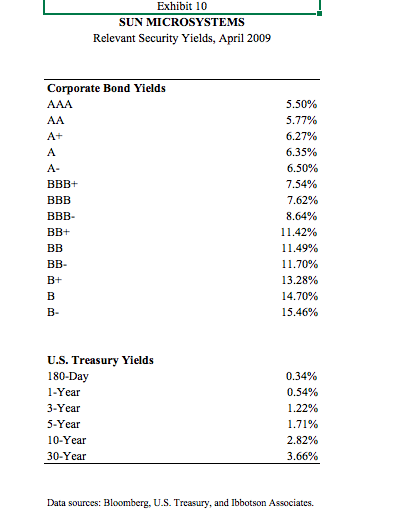
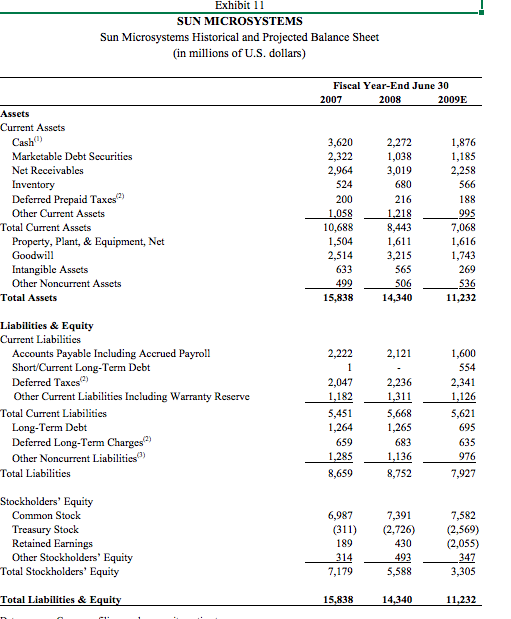
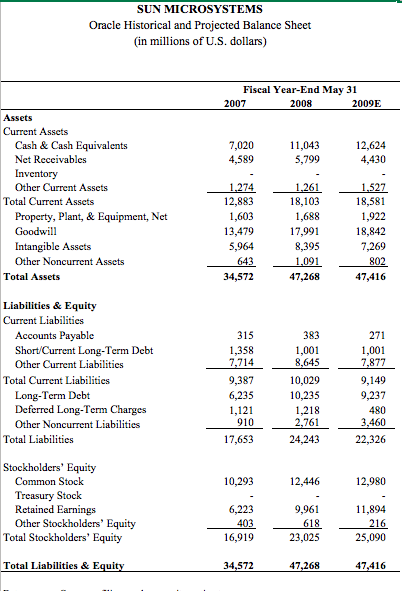
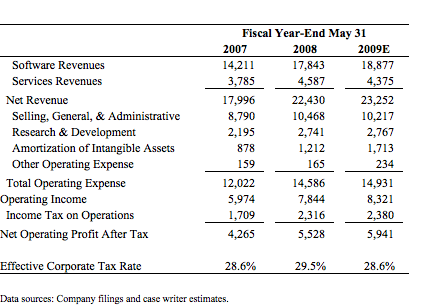
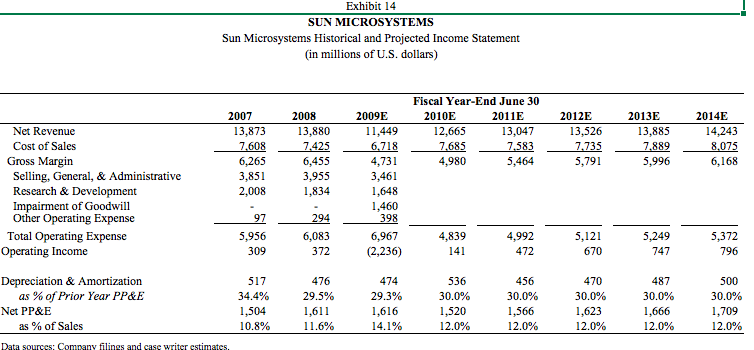
Exhibit 9 SUN MICROSYSTEMS IT Companies' Financial Data Stock Price (S) Shares Out (MM) Market Cap (SMM) BV Debt (SMM) Levered Beta Bond Rating Cash & Investments (SMM) LTM Sales (SMM) LTM EBIT (SMM) LTM LTM EBITDA Earnings (SMM) (SMM) Ticker 4,988 B A2 Primarily Hardware Advanced Micro Devices Apple Dell EMC Hewlett-Packard Intel International Business Machines NetApp Sun Microsystems AMD AAPL DELL EMC HPQ INTC IBM NTAP JAVA 3.56 123.42 11.06 12.81 36.30 15.60 101.27 17.59 6.69 609 889 1,944 2,041 2,416 2,562 1,343 330 739 2,168 109,713 21,505 26,142 87,708 39,967 136,052 5,808 4,941 2.19 1.11 1.12 1.39 1.25 1.20 0.93 1.80 1.73 2,011 3,404 20,458 1,988 33,925 1,265 1,257 A2 933 24,490 9,546 6,446 10,140 8,840 12,907 2,604 3,061 5,808 37,096 61,101 14,876 118,697 37,586 103,630 3,464 13,438 (1,955) 7,984 3,190 1,569 10,354 8,954 16,715 116 (2,231) (732) 8,739 3,959 2,626 14,175 13,570 22,165 286 (1,757) (3,098) 5,728 2,478 1,346 8,050 5,292 12,334 101 A1 A1 Bal n/a Primarily Software Adobe Systems Microsoft Novell Oracle Red Hat ADBE MSFT NOVL ORCL RHT 24.70 19.20 3.94 19.06 18.32 524 8,896 343 5,046 190 12,944 170,795 1,353 96,180 3,482 350 2.000 122 11,238 1.32 0.99 1.50 1.27 1.20 B1 2,018 31,447 1,067 12,624 663 3,476 61,981 940 23,630 628 961 22,128 10 8,406 80 1,231 24,485 55 10,291 119 809 17,232 (15) 5,739 85 A2 BB Market data as of April 17, 2009 Data sources: Yahoo Finance, Moody's, Bloomberg, and company filings Exhibit 10 SUN MICROSYSTEMS Relevant Security Yields, April 2009 Corporate Bond Yields AAA AA A+ A A- BBB+ BBB BBB- BB+ BB BB- B+ B B- 5.50% 5.77% 6.27% 6.35% 6.50% 7.54% 7.62% 8.64% 11.42% 11.49% 11.70% 13.28% 14.70% 15.46% U.S. Treasury Yields 180-Day 1-Year 3-Year 5-Year 10-Year 30-Year 0.34% 0.54% 1.22% 1.71% 2.82% 3.66% Data sources: Bloomberg, U.S. Treasury, and Ibbotson Associates. Exhibit 11 SUN MICROSYSTEMS Sun Microsystems Historical and Projected Balance Sheet (in millions of U.S. dollars) Fiscal Year-End June 30 2007 2008 2009E 2,272 1,038 3,019 680 Assets Current Assets Cash) Marketable Debt Securities Net Receivables Inventory Deferred Prepaid Taxes Other Current Assets Total Current Assets Property, Plant, & Equipment, Net Goodwill Intangible Assets Other Noncurrent Assets Total Assets 3,620 2,322 2,964 524 200 1.058 10,688 1,504 2,514 633 499 15,838 216 1,218 8,443 1,611 3,215 565 506 14,340 1,876 1,185 2,258 566 188 995 7,068 1,616 1,743 269 536 11,232 2,121 Liabilities & Equity Current Liabilities Accounts Payable Including Accrued Payroll Short/Current Long-Term Debt Deferred Taxes Other Current Liabilities Including Warranty Reserve Total Current Liabilities Long-Term Debt Deferred Long-Term Charges Other Noncurrent Liabilities Total Liabilities Stockholders' Equity Common Stock Treasury Stock Retained Earnings Other Stockholders' Equity Total Stockholders' Equity 2,222 1 2,047 1,182 5,451 1,264 659 1,285 8,659 2,236 1,311 5,668 1,265 683 1,136 8,752 1,600 554 2,341 1,126 5,621 695 635 976 7,927 6,987 (311) 189 314 7,179 7,391 (2,726) 430 493 5,588 7,582 (2,569) (2,055) 347 3,305 Total Liabilities & Equity 15.838 14,340 11,232 SUN MICROSYSTEMS Oracle Historical and Projected Balance Sheet (in millions of U.S. dollars) Fiscal Year-End May 31 2007 2008 2009E 7,020 4,589 11,043 5,799 12,624 4,430 Assets Current Assets Cash & Cash Equivalents Net Receivables Inventory Other Current Assets Total Current Assets Property, Plant, & Equipment, Net Goodwill Intangible Assets Other Noncurrent Assets Total Assets 1.274 12,883 1,603 13,47 5,964 643 34,572 1.261 18,103 1,688 ,99 8,395 1,091 47,268 1.527 18,581 1,922 18,842 7,269 802 47,416 Liabilities & Equity Current Liabilities Accounts Payable Short/Current Long-Term Debt Other Current Liabilities Total Current Liabilities Long-Term Debt Deferred Long-Term Charges Other Noncurrent Liabilities Total Liabilities Stockholders' Equity Common Stock Treasury Stock Retained Earnings Other Stockholders' Equity Total Stockholders' Equity 315 1,358 7,714 9,387 6,235 1,121 910 17,653 383 1,001 8,645 10,029 10,235 1,218 2.761 24,243 271 1,001 7,877 9.149 9,237 480 3,460 22,326 10,293 12,446 12,980 6,223 403 16,919 9,961 618 23,025 11,894 216 25,090 Total Liabilities & Equity 34,572 47,268 47,416 Software Revenues Services Revenues Net Revenue Selling, General, & Administrative Research & Development Amortization of Intangible Assets Other Operating Expense Total Operating Expense Operating Income Income Tax on Operations Net Operating Profit After Tax Fiscal Year-End May 31 2007 2008 2009E 14,211 17,843 18,877 3,785 4,587 4,375 17,996 22,430 23,252 8,790 10,468 10,217 2,195 2,741 2,767 878 1,212 1,713 159 165 234 12,022 14,586 14,931 5,974 7,844 8,321 1,709 2,316 2,380 4,265 5,528 5,941 Effective Corporate Tax Rate 28.6% 29.5% 28.6% Data sources: Company filings and case writer estimates. Exhibit 14 SUN MICROSYSTEMS Sun Microsystems Historical and Projected Income Statement in millions of U.S. dollars) 2007 13,873 7.608 6,265 3,851 2,008 Fiscal Year-End June 30 2010E 2011E 12,665 13,047 7.685 7.583 4,980 5,464 2008 13,880 7.425 6,455 3,955 1,834 2012E 13,526 7.735 5,791 2013E 13,885 7.889 5,996 Net Revenue Cost of Sales Gross Margin Selling, General, & Administrative Research & Development Impairment of Goodwill Other Operating Expense Total Operating Expense Operating Income 2014E 14,243 8,075 6,168 2009E 11,449 6.718 4,731 3,461 1,648 1,460 398 6,967 (2,236) 294 97 5,956 309 6,083 372 4,839 141 4,992 472 5,121 670 5,249 747 5,372 796 Depreciation & Amortization as % of Prior Year PP&E Net PP&E as % of Sales Data Sources: Company filings and case writer estimates. 517 34.4% 1,504 10.8% 476 29.5% 1,611 11.6% 474 29.3% 1,616 14.1% 536 30.0% 1,520 12.0% 456 30.0% 1,566 12.0% 470 30.0% 1,623 12.0% 487 30.0% 1,666 12.0% 500 30.0% 1,709 12.0% Exhibit 9 SUN MICROSYSTEMS IT Companies' Financial Data Stock Price (S) Shares Out (MM) Market Cap (SMM) BV Debt (SMM) Levered Beta Bond Rating Cash & Investments (SMM) LTM Sales (SMM) LTM EBIT (SMM) LTM LTM EBITDA Earnings (SMM) (SMM) Ticker 4,988 B A2 Primarily Hardware Advanced Micro Devices Apple Dell EMC Hewlett-Packard Intel International Business Machines NetApp Sun Microsystems AMD AAPL DELL EMC HPQ INTC IBM NTAP JAVA 3.56 123.42 11.06 12.81 36.30 15.60 101.27 17.59 6.69 609 889 1,944 2,041 2,416 2,562 1,343 330 739 2,168 109,713 21,505 26,142 87,708 39,967 136,052 5,808 4,941 2.19 1.11 1.12 1.39 1.25 1.20 0.93 1.80 1.73 2,011 3,404 20,458 1,988 33,925 1,265 1,257 A2 933 24,490 9,546 6,446 10,140 8,840 12,907 2,604 3,061 5,808 37,096 61,101 14,876 118,697 37,586 103,630 3,464 13,438 (1,955) 7,984 3,190 1,569 10,354 8,954 16,715 116 (2,231) (732) 8,739 3,959 2,626 14,175 13,570 22,165 286 (1,757) (3,098) 5,728 2,478 1,346 8,050 5,292 12,334 101 A1 A1 Bal n/a Primarily Software Adobe Systems Microsoft Novell Oracle Red Hat ADBE MSFT NOVL ORCL RHT 24.70 19.20 3.94 19.06 18.32 524 8,896 343 5,046 190 12,944 170,795 1,353 96,180 3,482 350 2.000 122 11,238 1.32 0.99 1.50 1.27 1.20 B1 2,018 31,447 1,067 12,624 663 3,476 61,981 940 23,630 628 961 22,128 10 8,406 80 1,231 24,485 55 10,291 119 809 17,232 (15) 5,739 85 A2 BB Market data as of April 17, 2009 Data sources: Yahoo Finance, Moody's, Bloomberg, and company filings Exhibit 10 SUN MICROSYSTEMS Relevant Security Yields, April 2009 Corporate Bond Yields AAA AA A+ A A- BBB+ BBB BBB- BB+ BB BB- B+ B B- 5.50% 5.77% 6.27% 6.35% 6.50% 7.54% 7.62% 8.64% 11.42% 11.49% 11.70% 13.28% 14.70% 15.46% U.S. Treasury Yields 180-Day 1-Year 3-Year 5-Year 10-Year 30-Year 0.34% 0.54% 1.22% 1.71% 2.82% 3.66% Data sources: Bloomberg, U.S. Treasury, and Ibbotson Associates. Exhibit 11 SUN MICROSYSTEMS Sun Microsystems Historical and Projected Balance Sheet (in millions of U.S. dollars) Fiscal Year-End June 30 2007 2008 2009E 2,272 1,038 3,019 680 Assets Current Assets Cash) Marketable Debt Securities Net Receivables Inventory Deferred Prepaid Taxes Other Current Assets Total Current Assets Property, Plant, & Equipment, Net Goodwill Intangible Assets Other Noncurrent Assets Total Assets 3,620 2,322 2,964 524 200 1.058 10,688 1,504 2,514 633 499 15,838 216 1,218 8,443 1,611 3,215 565 506 14,340 1,876 1,185 2,258 566 188 995 7,068 1,616 1,743 269 536 11,232 2,121 Liabilities & Equity Current Liabilities Accounts Payable Including Accrued Payroll Short/Current Long-Term Debt Deferred Taxes Other Current Liabilities Including Warranty Reserve Total Current Liabilities Long-Term Debt Deferred Long-Term Charges Other Noncurrent Liabilities Total Liabilities Stockholders' Equity Common Stock Treasury Stock Retained Earnings Other Stockholders' Equity Total Stockholders' Equity 2,222 1 2,047 1,182 5,451 1,264 659 1,285 8,659 2,236 1,311 5,668 1,265 683 1,136 8,752 1,600 554 2,341 1,126 5,621 695 635 976 7,927 6,987 (311) 189 314 7,179 7,391 (2,726) 430 493 5,588 7,582 (2,569) (2,055) 347 3,305 Total Liabilities & Equity 15.838 14,340 11,232 SUN MICROSYSTEMS Oracle Historical and Projected Balance Sheet (in millions of U.S. dollars) Fiscal Year-End May 31 2007 2008 2009E 7,020 4,589 11,043 5,799 12,624 4,430 Assets Current Assets Cash & Cash Equivalents Net Receivables Inventory Other Current Assets Total Current Assets Property, Plant, & Equipment, Net Goodwill Intangible Assets Other Noncurrent Assets Total Assets 1.274 12,883 1,603 13,47 5,964 643 34,572 1.261 18,103 1,688 ,99 8,395 1,091 47,268 1.527 18,581 1,922 18,842 7,269 802 47,416 Liabilities & Equity Current Liabilities Accounts Payable Short/Current Long-Term Debt Other Current Liabilities Total Current Liabilities Long-Term Debt Deferred Long-Term Charges Other Noncurrent Liabilities Total Liabilities Stockholders' Equity Common Stock Treasury Stock Retained Earnings Other Stockholders' Equity Total Stockholders' Equity 315 1,358 7,714 9,387 6,235 1,121 910 17,653 383 1,001 8,645 10,029 10,235 1,218 2.761 24,243 271 1,001 7,877 9.149 9,237 480 3,460 22,326 10,293 12,446 12,980 6,223 403 16,919 9,961 618 23,025 11,894 216 25,090 Total Liabilities & Equity 34,572 47,268 47,416 Software Revenues Services Revenues Net Revenue Selling, General, & Administrative Research & Development Amortization of Intangible Assets Other Operating Expense Total Operating Expense Operating Income Income Tax on Operations Net Operating Profit After Tax Fiscal Year-End May 31 2007 2008 2009E 14,211 17,843 18,877 3,785 4,587 4,375 17,996 22,430 23,252 8,790 10,468 10,217 2,195 2,741 2,767 878 1,212 1,713 159 165 234 12,022 14,586 14,931 5,974 7,844 8,321 1,709 2,316 2,380 4,265 5,528 5,941 Effective Corporate Tax Rate 28.6% 29.5% 28.6% Data sources: Company filings and case writer estimates. Exhibit 14 SUN MICROSYSTEMS Sun Microsystems Historical and Projected Income Statement in millions of U.S. dollars) 2007 13,873 7.608 6,265 3,851 2,008 Fiscal Year-End June 30 2010E 2011E 12,665 13,047 7.685 7.583 4,980 5,464 2008 13,880 7.425 6,455 3,955 1,834 2012E 13,526 7.735 5,791 2013E 13,885 7.889 5,996 Net Revenue Cost of Sales Gross Margin Selling, General, & Administrative Research & Development Impairment of Goodwill Other Operating Expense Total Operating Expense Operating Income 2014E 14,243 8,075 6,168 2009E 11,449 6.718 4,731 3,461 1,648 1,460 398 6,967 (2,236) 294 97 5,956 309 6,083 372 4,839 141 4,992 472 5,121 670 5,249 747 5,372 796 Depreciation & Amortization as % of Prior Year PP&E Net PP&E as % of Sales Data Sources: Company filings and case writer estimates. 517 34.4% 1,504 10.8% 476 29.5% 1,611 11.6% 474 29.3% 1,616 14.1% 536 30.0% 1,520 12.0% 456 30.0% 1,566 12.0% 470 30.0% 1,623 12.0% 487 30.0% 1,666 12.0% 500 30.0% 1,709 12.0%