

Answered step by step
Verified Expert Solution
Question
1 Approved Answer
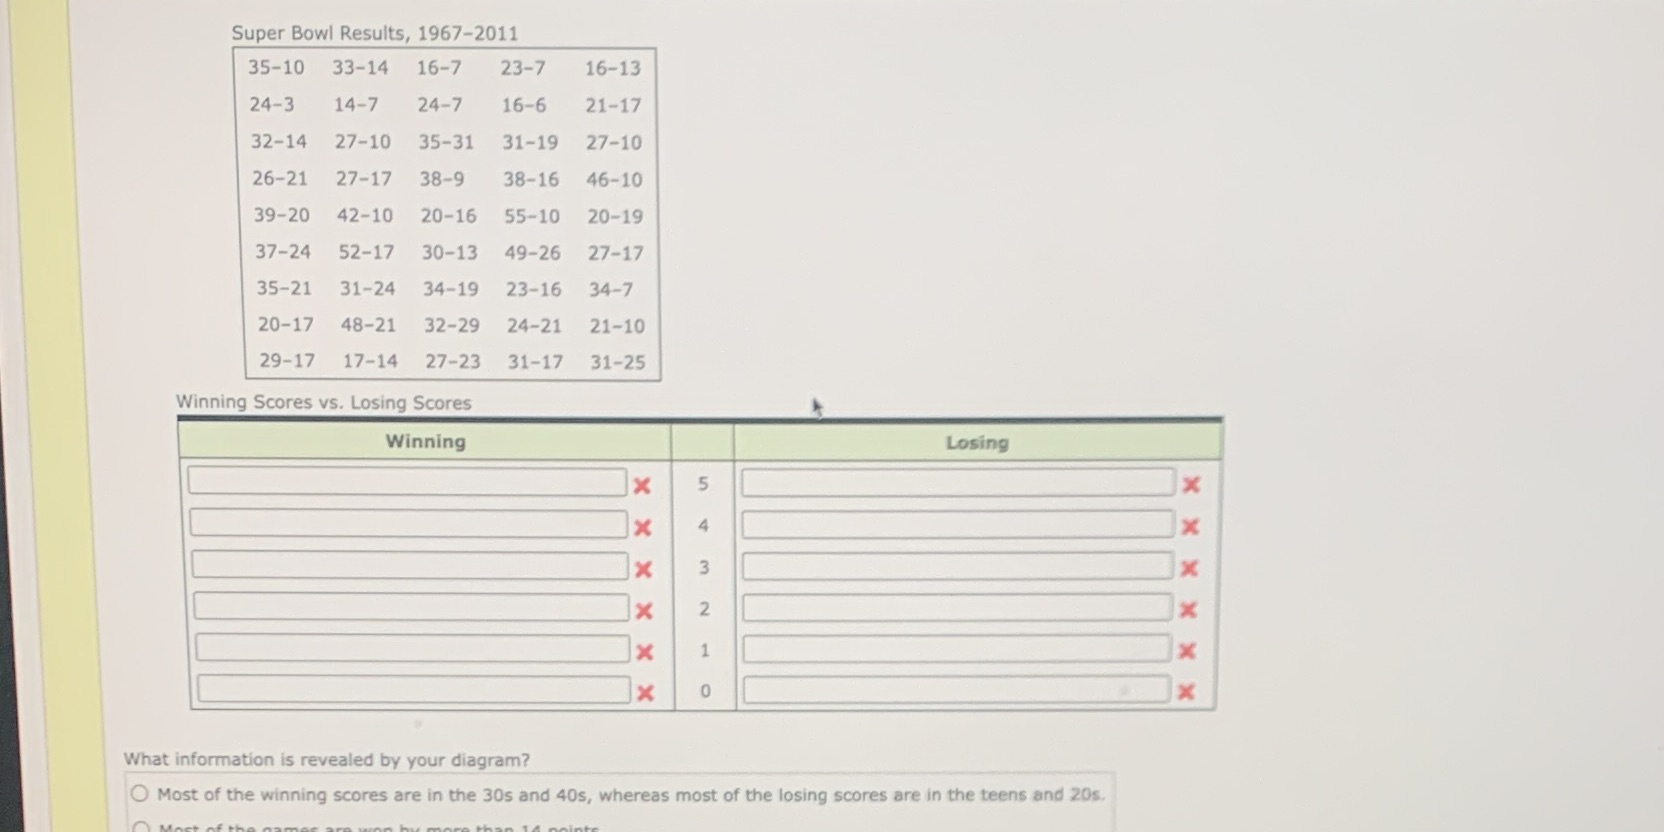
Super Bowl Results, 1967-2011 35-10 33-14 16-7 23-7 16-13 24-3 14-7 24-7 16-6 21-17 32-14 27-10 35-31 31-19 27-10 26-21 27-17 38-9 38-16 46-10 39-20
Step by Step Solution
There are 3 Steps involved in it
Step: 1

Get Instant Access to Expert-Tailored Solutions
See step-by-step solutions with expert insights and AI powered tools for academic success
Step: 2

Step: 3
Ace Your Homework with AI
Get the answers you need in no time with our AI-driven, step-by-step assistance
Get Started
Interconnection Networks
Authors: J C Bermond
1st Edition
1483295273, 9781483295275