Question
Supplied code: clear all %clear all variables in the workspace close all %set up discretization size del_x = .01; % step size in x direction

Supplied code:
clear all %clear all variables in the workspace
close all
%set up discretization size
del_x = .01; % step size in x direction m
del_t = 0.2; % step size in time sec
x_tot =0.5; % total column length m
t_tot = 1*60 %total time s
%set up elements
n=x_tot/del_x; % total number of elements, including boundary elements
x_pos=[del_x/2:del_x:x_tot]; % row matrix of x coordinate positions along the rebar
B=zeros(n,1); % load vector
x=ones(n,1); % variable matrix
A=eye(n); % identity matrix
% set up thermal properties
D = 1e-4;%1e-2% disperion coefficident
lam_1 = D*del_t/del_x^2; %lambda value for dispersion
% set up boundary conditions
bc_L = 1; % left boundary condition degrees C
bc_R = 0; % right boundary condition degrees C
IC = 0; %initial condition
% set boundary and initial conditions to appropriate elements
x = x*IC;
B(1,1)=bc_L;
B(n,1)=bc_R;
%solve and plot system of equations
for i=del_t:del_t:t_tot
Seconds_Simulated= i
Minutes_Simulated = i/60
B(2:end-1)=(lam_1*(x(3:end)-2*x(2:end-1)+x(1:end-2)))+x(2:end-1); %forward stepping explicit
x = A\B; %solve for x
plot(x_pos',x); %plot output for this timestep
%plot(x_pos',B); %plot output for this timestep
axis([0 x_tot 0 max(bc_L,bc_R)]) % define axes
pause(0.01) %pause so we can see it
end
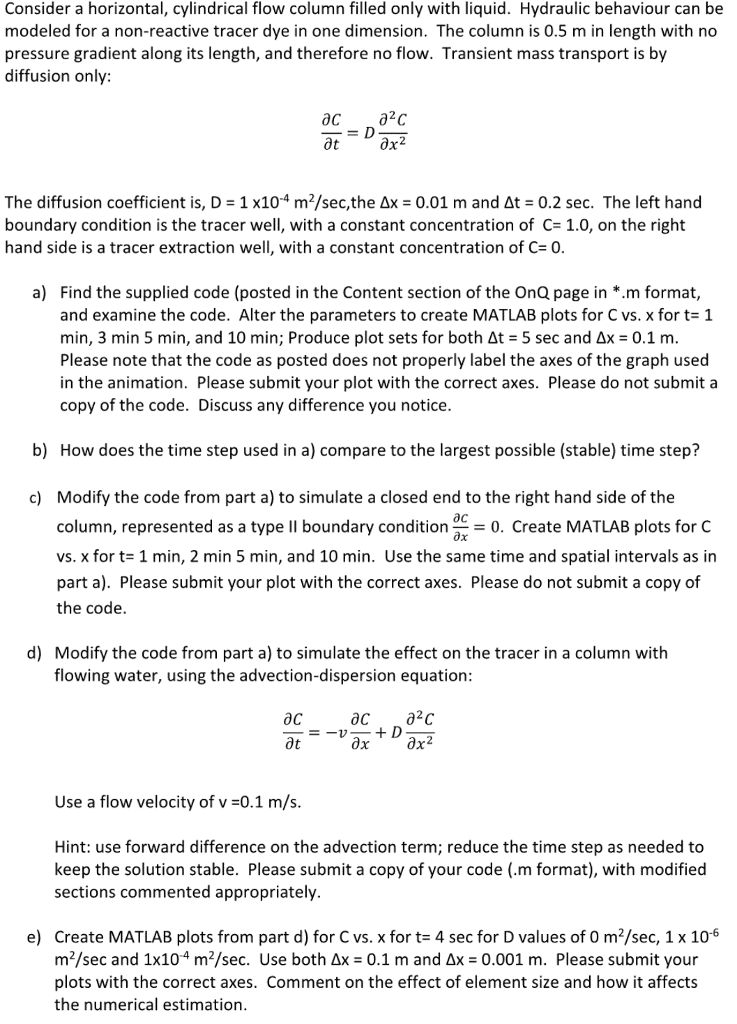
Consider a horizontal, cylindrical flow column filled only with liquid. Hydraulic behaviour can be modeled for a non-reactive tracer dye in one dimension. The column is 0.5 m in length with no pressure gradient along its length, and therefore no flow. Transient mass transport is by diffusion only ac ac ot The diffusion coefficient is, D = 1 x10⁻⁴ m2/sec,the x = 0.01 m and At = 0.2 sec. The left hand boundary condition is the tracer well, with a constant concentration of C= 1.0, on the right hand side is a tracer extraction well' with a constant concentration of C= 0 a) Find the supplied code (posted in the Content section of the OnQ page in *.m format, and examine the code. Alter the parameters to create MATLAB plots for C vs. x for t= 1 min, 3 min 5 min, and 10 min: Produce plot sets for both At = 5 sec and x 0.1 m Please note that the code as posted does not properly label the axes of the graph used in the animation. Please submit your plot with the correct axes. Please do not submit a copy of the code. Discuss any difference you notice b) How does the time step used in a) compare to the largest possible (stable) time step? Modify the code from part a) to simulate a closed end to the right hand side of the column, represented as a type ll boundary condition-= 0, Create MATLAB plots for C vs. x for t- 1 min, 2 min 5 min, and 10 min. Use the same time and spatial intervals as in part a). Please submit your plot with the correct axes. Please do not submit a copy of the code c) ac d) Modify the code from part a) to simulate the effect on the tracer in a column with flowing water, using the advection-dispersion equation ac ot Use a flow velocity of v =0.1 m/s Hint: use forward difference on the advection term; reduce the time step as needed to keep the solution stable. Please submit a copy of your code (.m format), with modified sections commented appropriately Create MATLAB plots from part d) for C vs. x for t= 4 sec for D values of 0 m2/sec, 1 x 10⁻⁶ m2/sec and 1x10⁻⁴ m2/sec. Use both x = 0.1 m and . 0.001 m. Please submit your plots with the correct axes. Comment on the effect of element size and how it affects the numerical estimation e) Consider a horizontal, cylindrical flow column filled only with liquid. Hydraulic behaviour can be modeled for a non-reactive tracer dye in one dimension. The column is 0.5 m in length with no pressure gradient along its length, and therefore no flow. Transient mass transport is by diffusion only ac ac ot The diffusion coefficient is, D = 1 x10⁻⁴ m2/sec,the x = 0.01 m and At = 0.2 sec. The left hand boundary condition is the tracer well, with a constant concentration of C= 1.0, on the right hand side is a tracer extraction well' with a constant concentration of C= 0 a) Find the supplied code (posted in the Content section of the OnQ page in *.m format, and examine the code. Alter the parameters to create MATLAB plots for C vs. x for t= 1 min, 3 min 5 min, and 10 min: Produce plot sets for both At = 5 sec and x 0.1 m Please note that the code as posted does not properly label the axes of the graph used in the animation. Please submit your plot with the correct axes. Please do not submit a copy of the code. Discuss any difference you notice b) How does the time step used in a) compare to the largest possible (stable) time step? Modify the code from part a) to simulate a closed end to the right hand side of the column, represented as a type ll boundary condition-= 0, Create MATLAB plots for C vs. x for t- 1 min, 2 min 5 min, and 10 min. Use the same time and spatial intervals as in part a). Please submit your plot with the correct axes. Please do not submit a copy of the code c) ac d) Modify the code from part a) to simulate the effect on the tracer in a column with flowing water, using the advection-dispersion equation ac ot Use a flow velocity of v =0.1 m/s Hint: use forward difference on the advection term; reduce the time step as needed to keep the solution stable. Please submit a copy of your code (.m format), with modified sections commented appropriately Create MATLAB plots from part d) for C vs. x for t= 4 sec for D values of 0 m2/sec, 1 x 10⁻⁶ m2/sec and 1x10⁻⁴ m2/sec. Use both x = 0.1 m and . 0.001 m. Please submit your plots with the correct axes. Comment on the effect of element size and how it affects the numerical estimation e)Step by Step Solution
There are 3 Steps involved in it
Step: 1

Get Instant Access to Expert-Tailored Solutions
See step-by-step solutions with expert insights and AI powered tools for academic success
Step: 2

Step: 3

Ace Your Homework with AI
Get the answers you need in no time with our AI-driven, step-by-step assistance
Get Started


