

Answered step by step
Verified Expert Solution
Question
1 Approved Answer
Supply Chain Optimization Dataset snapshots: Questions below: begin{tabular}{|l|l|r|} hline 1 & (Units/month) & multicolumn{1}{|c|}{ Demand } hline 2 & USA & 2,800,000 hline
Supply Chain Optimization
Dataset snapshots:
Questions below:
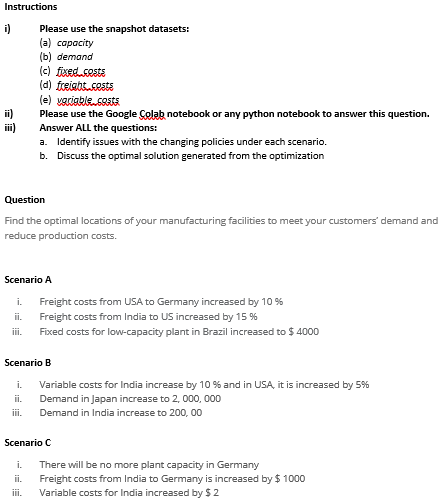
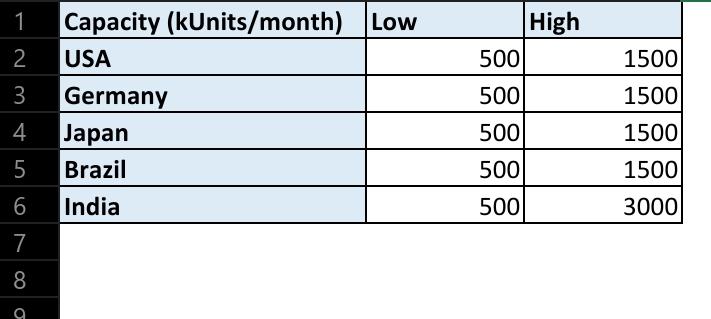
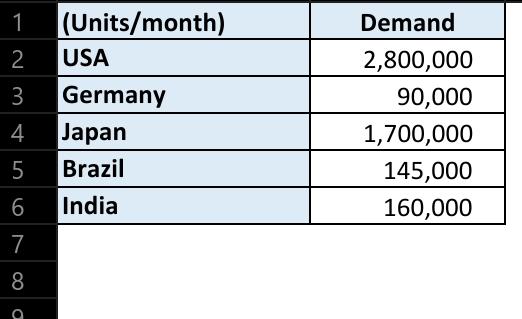
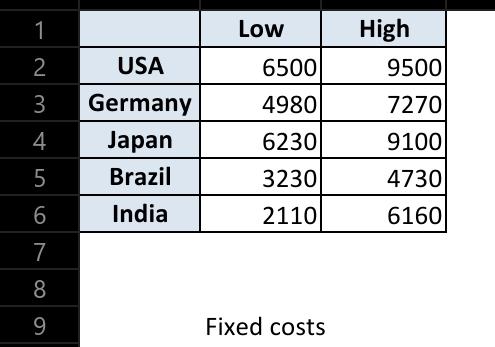
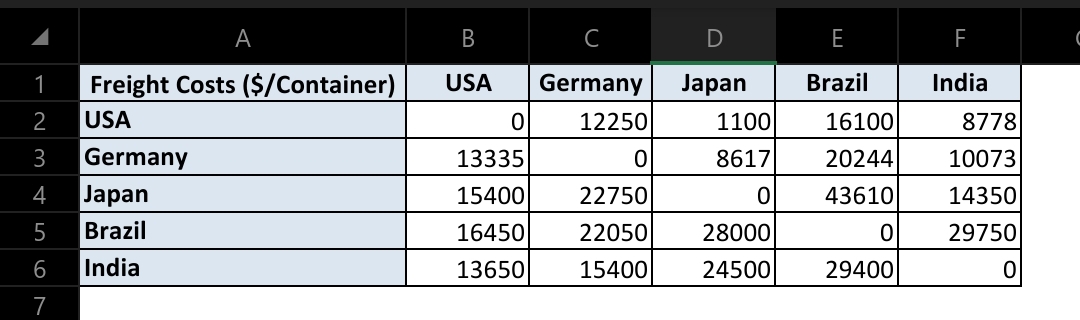
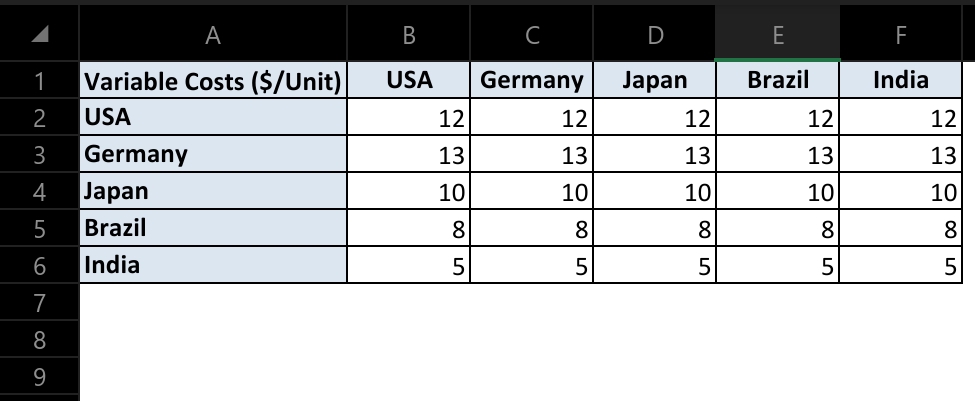
\begin{tabular}{|l|l|r|} \hline 1 & (Units/month) & \multicolumn{1}{|c|}{ Demand } \\ \hline 2 & USA & 2,800,000 \\ \hline 3 & Germany & 90,000 \\ \hline 4 & Japan & 1,700,000 \\ \hline 5 & Brazil & 145,000 \\ \hline 6 & India & 160,000 \\ \hline \end{tabular} Fixed costs \begin{tabular}{|c|l|r|r|r|r|r|} \hline \multicolumn{1}{|c|}{A} & \multicolumn{1}{c|}{B} & \multicolumn{1}{c}{C} \\ \multicolumn{1}{c|}{C} & \multicolumn{1}{c|}{D} & \multicolumn{1}{c|}{E} & \multicolumn{1}{c|}{F} \\ \hline 1 & Freight Costs (\$/Container) & \multicolumn{1}{c|}{ USA } & Germany & Japan & \multicolumn{1}{c|}{ Brazil } & \multicolumn{1}{c|}{ India } \\ \hline 2 & USA & 0 & 12250 & 1100 & 16100 & 8778 \\ \hline 3 & Germany & 13335 & 0 & 8617 & 20244 & 10073 \\ \hline 4 & Japan & 15400 & 22750 & 0 & 43610 & 14350 \\ \hline 5 & Brazil & 16450 & 22050 & 28000 & 0 & 29750 \\ \hline 6 & India & 13650 & 15400 & 24500 & 29400 & 0 \\ \hline \end{tabular} \begin{tabular}{|l|l|r|r|r|r|r|} \hline \multicolumn{1}{|c|}{ A } & \multicolumn{1}{c|}{ B } & \multicolumn{1}{c|}{ C } & \multicolumn{1}{c|}{D} & \multicolumn{1}{c|}{ E } & \multicolumn{1}{c|}{F} \\ \hline 1 & Variable Costs (\$/Unit) & USA & Germany & Japan & Brazil & \multicolumn{1}{|c|}{ India } \\ \hline 2 & USA & 12 & 12 & 12 & 12 & 12 \\ \hline 3 & Germany & 13 & 13 & 13 & 13 & 13 \\ \hline 4 & Japan & 10 & 10 & 10 & 10 & 10 \\ \hline 5 & Brazil & 8 & 8 & 8 & 8 & 8 \\ \hline 6 & India & 5 & 5 & 5 & 5 & 5 \\ \hline \end{tabular} i) Please use the snapshot datasets: (a) capacity (b) demand (c) fixed costs (d) freight costs (e) yquigble costs ii) Please use the Google Colab notebook or any python notebook to answer this question. iii) Answer ALL the questions: a. Identify issues with the changing policies under each scenario. b. Discuss the optimal solution generated from the optimization Question Find the optimal locations of your manufacturing facilities to meet your customers' demand and reduce production costs. Scenario A i. Freight costs from USA to Germany increased by 10% ii. Freight costs from India to US increased by 15% iii. Fixed costs for low-capacity plant in Brazil increased to $4000 Scenario B i. Variable costs for India increase by 10% and in USA, it is increased by 5% ii. Demand in Japan increase to 2,000,000 iii. Demand in India increase to 200,00 Scenario C i. There will be no more plant capacity in Germany ii. Freight costs from India to Germany is increased by $1000 iii. Variable costs for India increased by $2
Step by Step Solution
There are 3 Steps involved in it
Step: 1

Get Instant Access to Expert-Tailored Solutions
See step-by-step solutions with expert insights and AI powered tools for academic success
Step: 2

Step: 3
Ace Your Homework with AI
Get the answers you need in no time with our AI-driven, step-by-step assistance
Get Started
Advances In Database Technology Edbt 88 International Conference On Extending Database Technology Venice Italy March 14 18 1988 Proceedings Lncs 303
Authors: Joachim W. Schmidt ,Stefano Ceri ,Michele Missikoff
1988th Edition
3540190740, 978-3540190745