

Answered step by step
Verified Expert Solution
Question
1 Approved Answer
Supply Demand Quantity (units) What area represents the producer surplus at the competitive equilibrium in the graph shown unverified email address or mobile number. Please
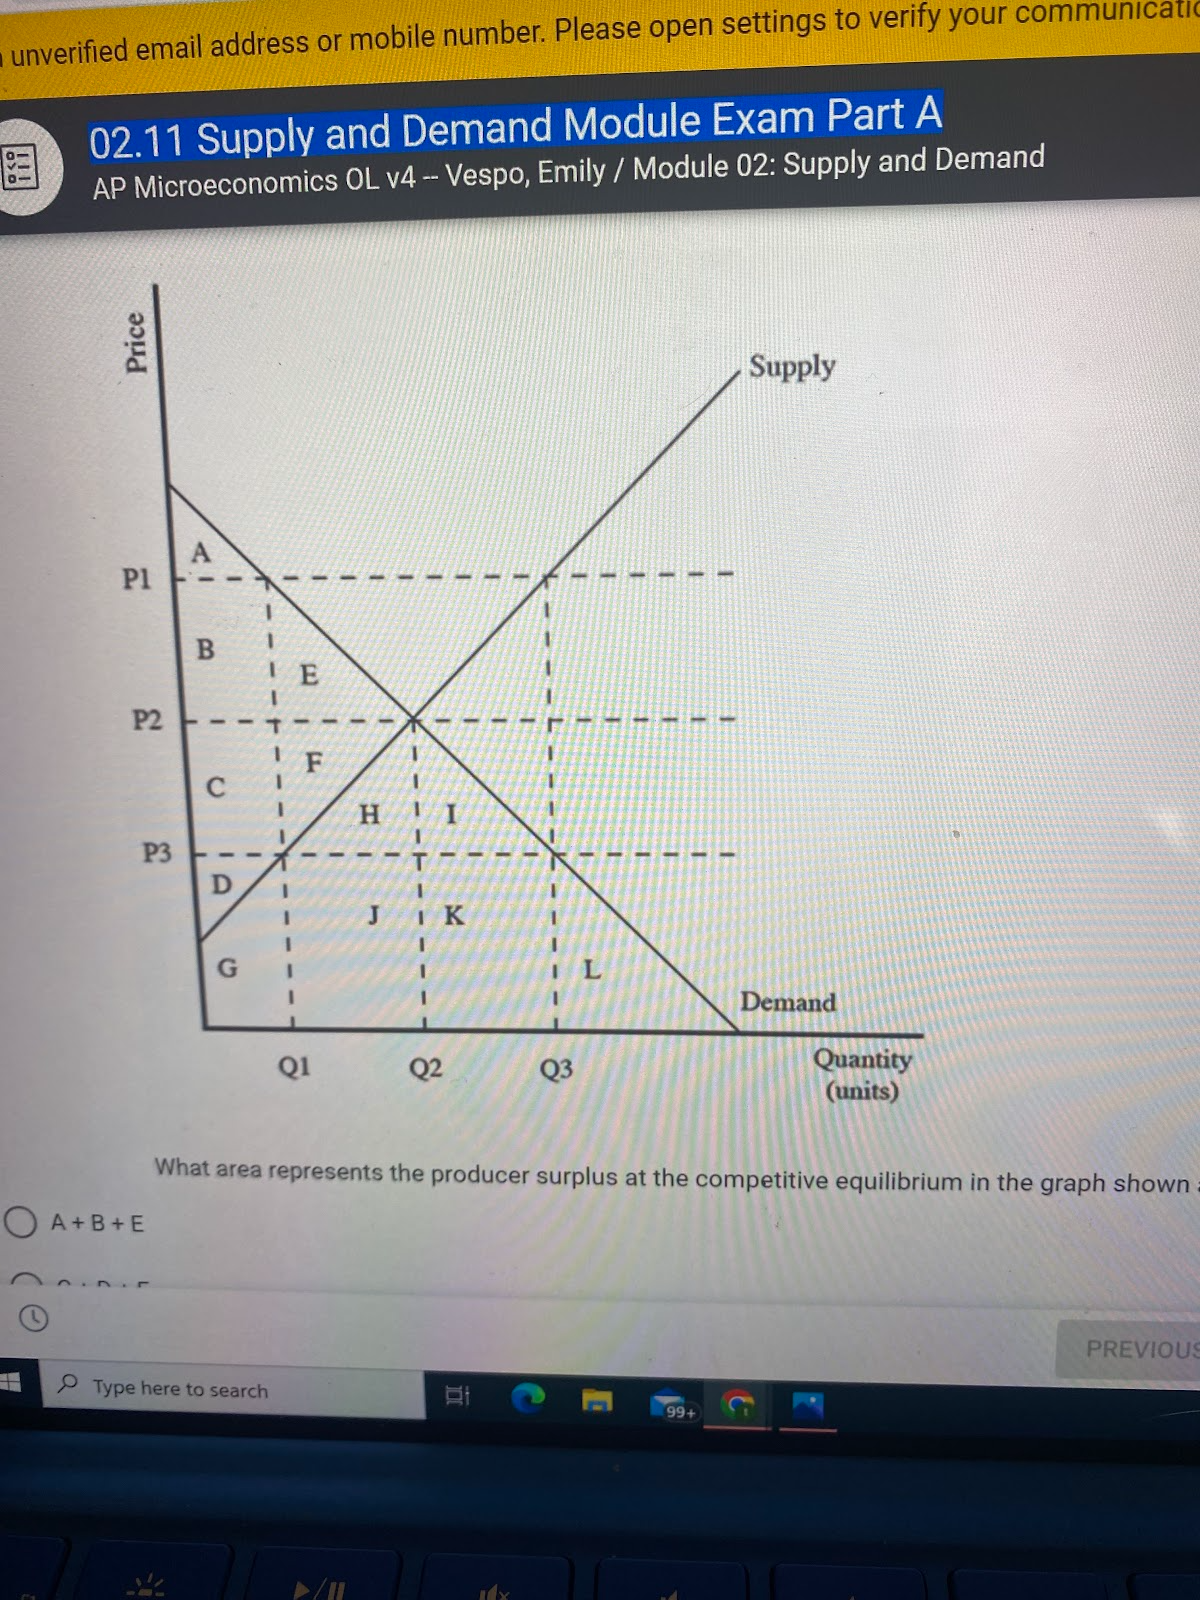
unverified email address or mobile number. Please open settings to verify your commumcatl( 02.11 Supply and Demand Module Exam Part A AP Microeconomics OL v4 Vespo, Emily / Module 02: Supply and Demand QI Q3 Supply Quantity (units) What area represents the producer surplus at the competitive equilibrium in the graph shown , OA+B+E PREVIOUS p Type here to search
Step by Step Solution
There are 3 Steps involved in it
Step: 1

Get Instant Access to Expert-Tailored Solutions
See step-by-step solutions with expert insights and AI powered tools for academic success
Step: 2

Step: 3
Ace Your Homework with AI
Get the answers you need in no time with our AI-driven, step-by-step assistance
Get Started
Capitalist Political Economy Thinkers And Theories
Authors: Heather Whiteside
1st Edition
0429888031, 9780429888038