Answered step by step
Verified Expert Solution
Question
1 Approved Answer
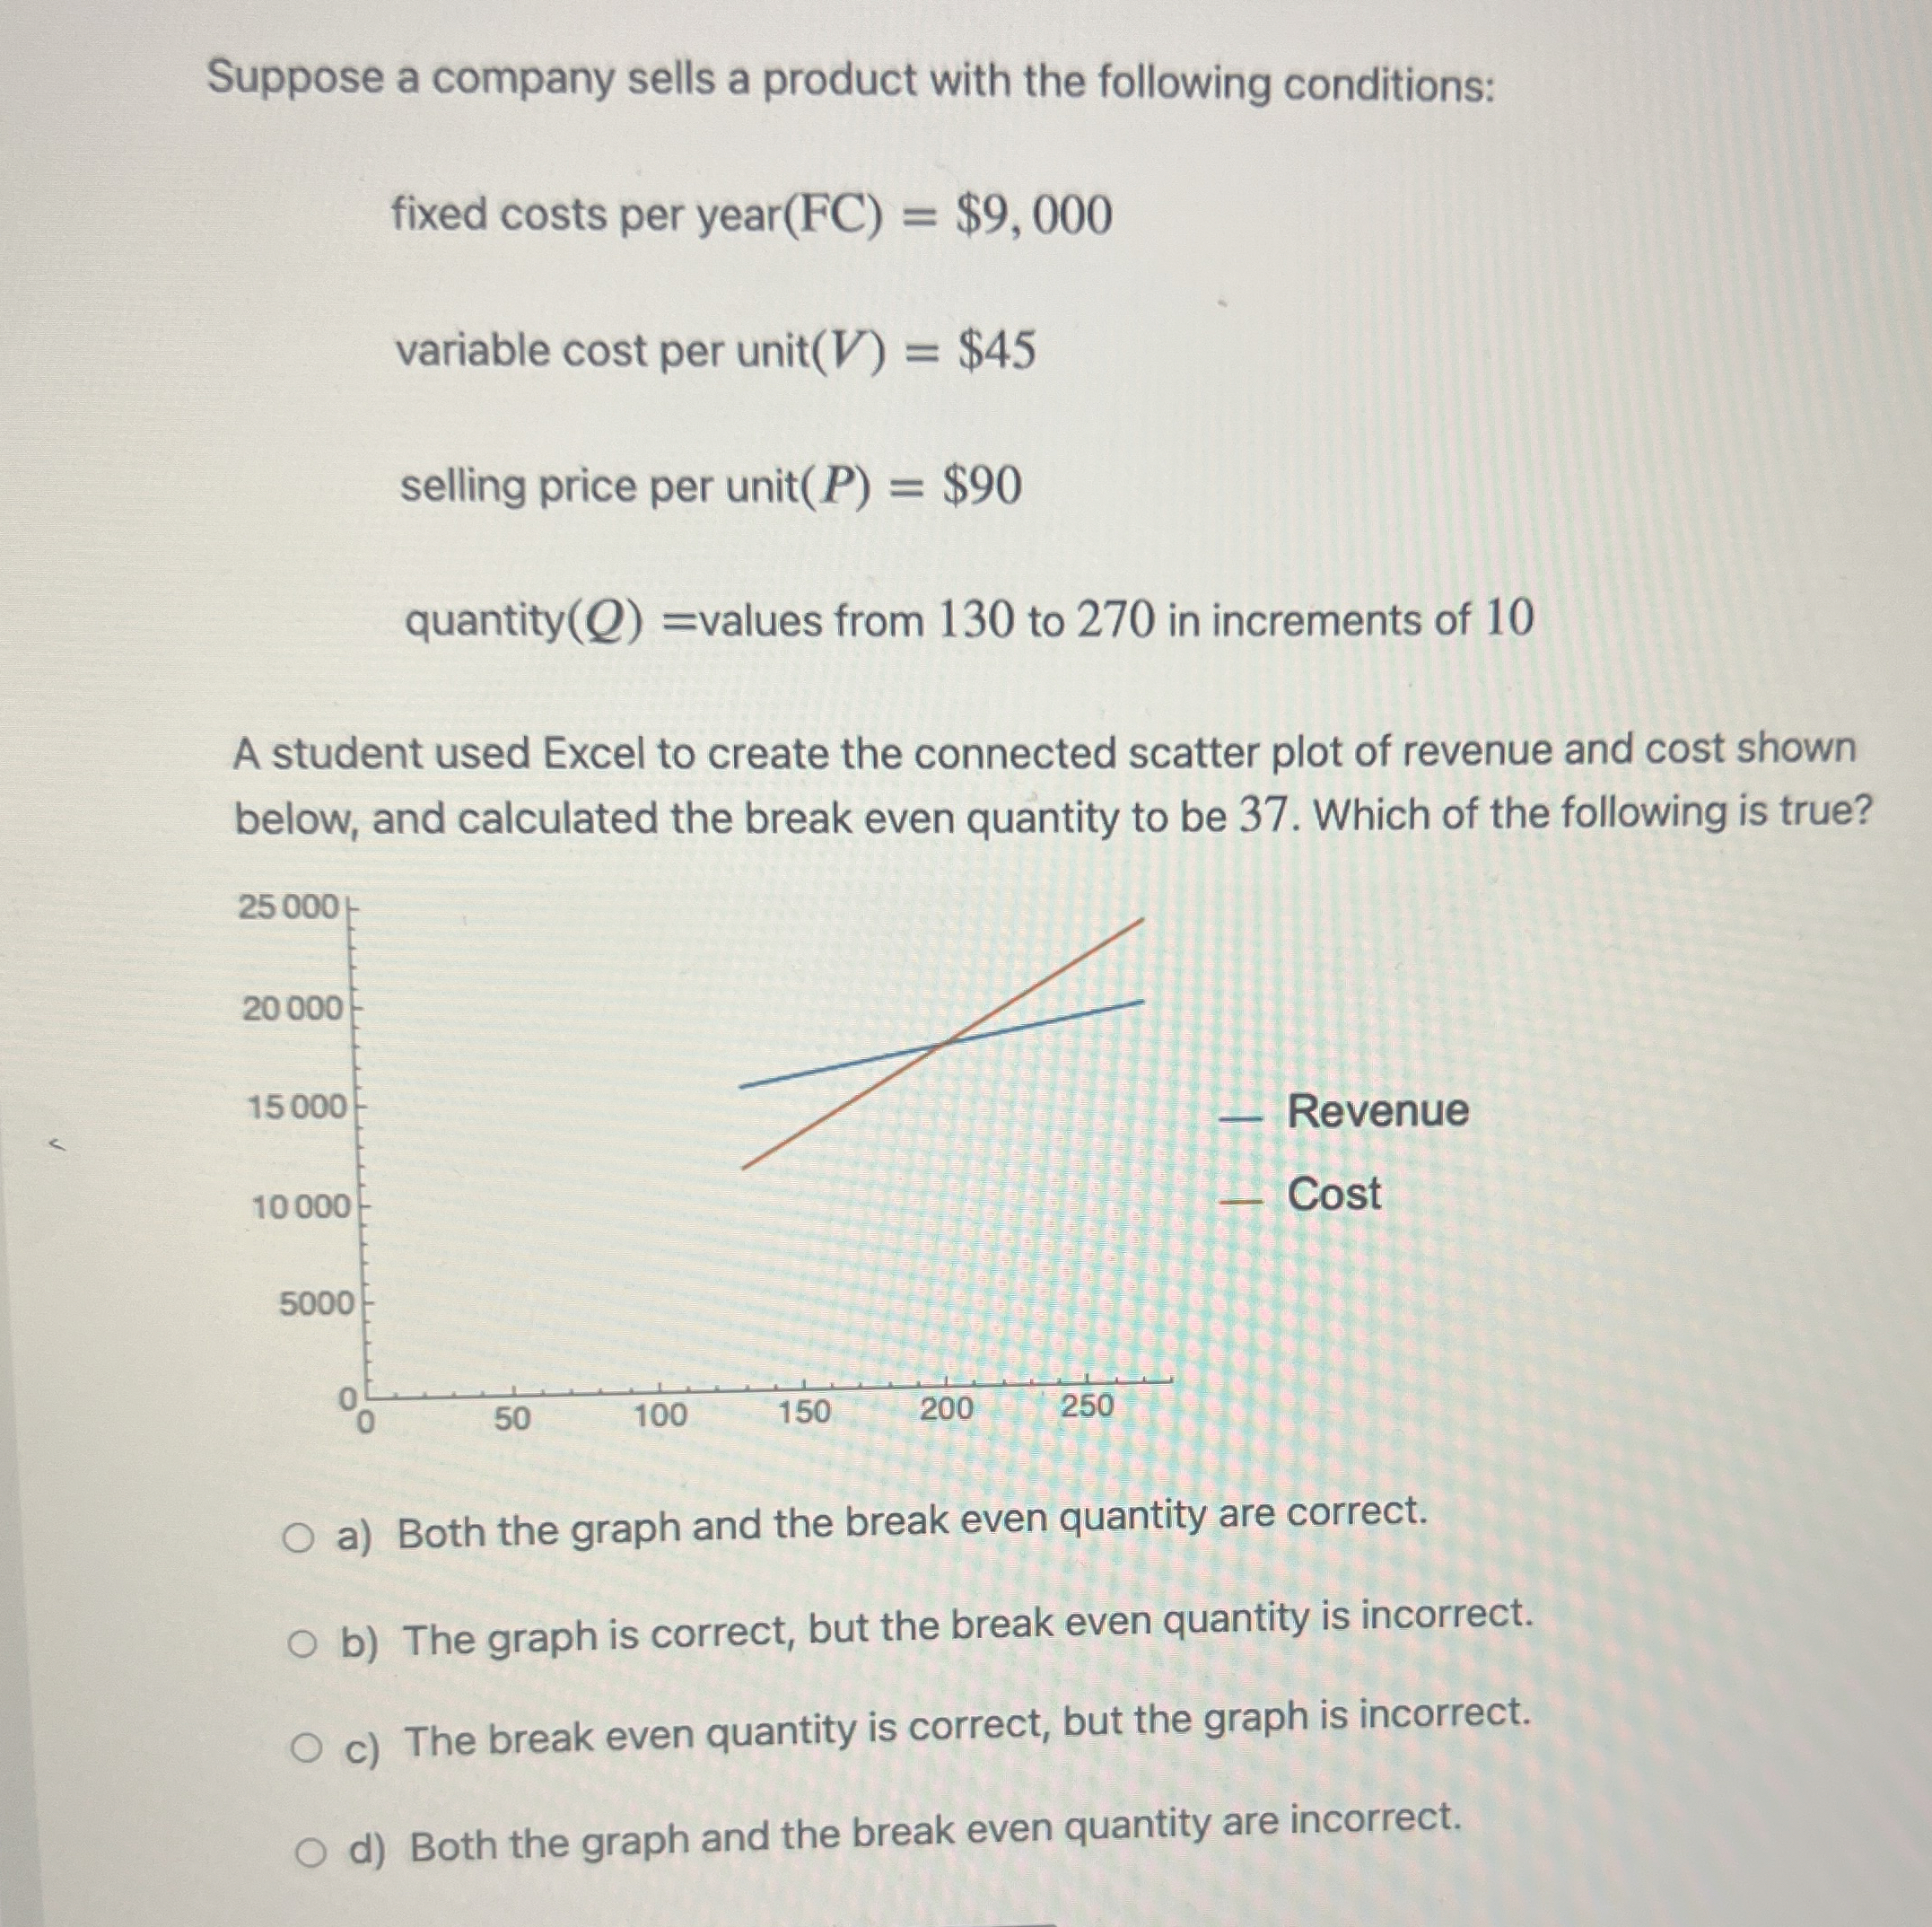
Suppose a company sells a product with the following conditions: fixed costs per year ( F C ) = $ 9 , 0 0 0
Suppose a company sells a product with the following conditions:
fixed costs per year $
variable cost per unit $
selling price per unit $
quantity values from increments
A student used Excel to create the connected scatter plot of revenue and cost shown below, and calculated the break even quantity to be Which of the following is true?
a Both the graph and the break even quantity are correct.
b The graph is correct, but the break even quantity is incorrect.
c The break even quantity is correct, but the graph is incorrect.
d Both the graph and the break even quantity are incorrect.

Step by Step Solution
There are 3 Steps involved in it
Step: 1

Get Instant Access to Expert-Tailored Solutions
See step-by-step solutions with expert insights and AI powered tools for academic success
Step: 2

Step: 3

Ace Your Homework with AI
Get the answers you need in no time with our AI-driven, step-by-step assistance
Get Started


