

Answered step by step
Verified Expert Solution
Question
1 Approved Answer
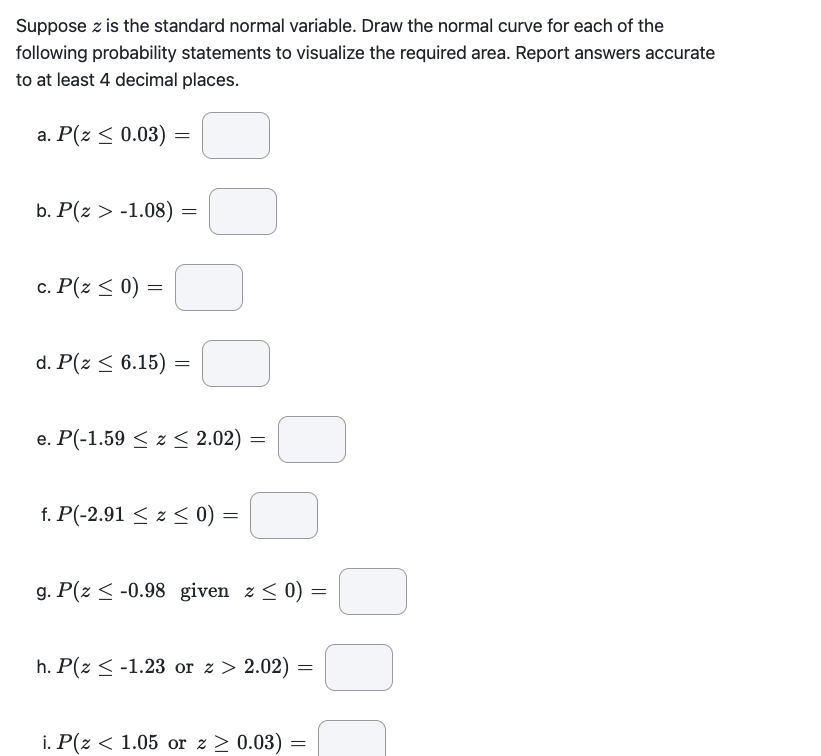
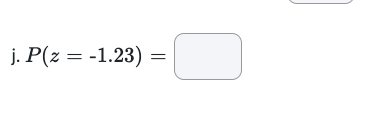
Suppose a is the standard normal variable. Draw the normal curve for each of the following probability statements to visualize the required area. Report answers
Step by Step Solution
There are 3 Steps involved in it
Step: 1

Get Instant Access to Expert-Tailored Solutions
See step-by-step solutions with expert insights and AI powered tools for academic success
Step: 2

Step: 3
Ace Your Homework with AI
Get the answers you need in no time with our AI-driven, step-by-step assistance
Get Started
Precalculus, Enhanced WebAssign Edition
Authors: James Stewart
6th Edition
1285499948, 9781285499949