Question
Seitz has a growing list of several hundred business-to-business customers. Managers would like to know whether the average dollar amount of sales per transaction per
Seitz has a growing list of several hundred business-to-business customers. Managers would like to know whether the average dollar amount of sales per transaction per customer has changed from last year. Company accountants sampled 20 customers randomly from last year’s records and determine that the mean sales per customer was $2,300 with a standard deviation of $500. They sampled 25 customers randomly from this year’s files and determined that the mean sales per customer for this sample was $2,450 with a standard deviation of $540. Analyze these data and summarize your finding for managers. Explain how this information can be used by decision makers. Assume that sales per customer are normally distributed.
One common approach to measuring a company’s quality is through the use of customer-satisfaction surveys. Suppose a random sample of Seitz’ customers are asked whether the plastic tractor produced by Seitz has outstanding quality (yes or no). Assume Seitz produces these tractors at two different plant locations and that the tractor customers can be divided according to where their tractors were manufactured. Suppose a random sample of 45 customers who bought tractors made at plant 1 results in 18 saying the tractors have excellent quality and a random sample of 51 customers who bought tractors made at plant 2 results in 12 saying the tractors have excellent quality: Use a confidence interval to express the estimated difference in population proportions of excellent ratings between the two groups of customers. Does it seem to matter which plant produces the tractors in terms of the quality rating received from customers? What would you report from these data?
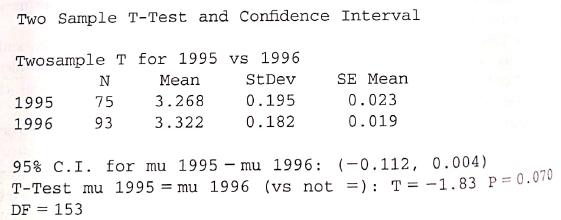
Suppose the customer-satisfaction survey included a question on the overall quality of Seitz measured on a 5-point scale with a 1 indicating low quality and a 5 indicating high quality. Company managers monitor the figures from year to year to help them determine whether Seitz is improving customers’ perception of its quality. Suppose random samples of the responses from 1995 customers and 1996 customers are taken and analyzed on this question, and the following MINITAB analysis of the data is given. Help managers interpret this analysis so that comparisons can be made between 1995 and 1996. Discuss the samples, the statistics, and the conclusions.

Suppose Seitz produces pulleys that are specified to be 50 mm in diameter. A large batch of pulleys is made in week 1 and another is made in week 5. Quality control people want to determine whether there is a difference in the variance of the diameters of the two batches. Assume that a sample of six pulleys from the week 1 batch results in the following diameter measurements (in mm): 51, 50, 48, 50, 49, 51. Assume that a sample of seven pulleys from the week 5 batch results in the following diameter measurements (in mm): 50, 48, 48, 51, 52, 50, 52. Conduct a test to determine whether the variance in diameters differs between these two populations. Why would the quality control people be interested in such a test? What result of this test would you relate to them? What about the means of these two batches? Analyze these data in terms of the means and report on the results.
Two Sample T-Test and Confidence Interval Twosample T for 1995 vs 1996 N Mean StDev SE Mean 1995 75 3.268 0.195 0.023 1996 93 3.322 0.182 0.019 95% C.I. for mu 1995 - mu 1996: (-0.112, 0.004) T-Test mu 1995 = mu 1996 (vs not =): T = -1.83 P = 0.070 DF = 153
Step by Step Solution
3.41 Rating (160 Votes )
There are 3 Steps involved in it
Step: 1
Given that Two samples 1 and and 2 sample Type sample size excellent quality sample 1 45 18 sample 2 ...
Get Instant Access to Expert-Tailored Solutions
See step-by-step solutions with expert insights and AI powered tools for academic success
Step: 2

Step: 3

Ace Your Homework with AI
Get the answers you need in no time with our AI-driven, step-by-step assistance
Get Started


