Question
The following table shows average Canadian gas prices, per litre, from 1979 to 2007. 1979 1983 1987 1991 0 4 8 12 1996 17
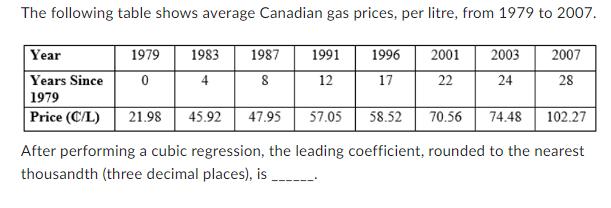
The following table shows average Canadian gas prices, per litre, from 1979 to 2007. 1979 1983 1987 1991 0 4 8 12 1996 17 Year Years Since 1979 Price (C/L) 21.98 45.92 47.95 57.05 58.52 70.56 74.48 2001 2003 22 24 2007 28 102.27 After performing a cubic regression, the leading coefficient, rounded to the nearest thousandth (three decimal places), is
Step by Step Solution
3.41 Rating (154 Votes )
There are 3 Steps involved in it
Step: 1
Step 1 The cubic regression equation for Y ie dependent variable price on X ie independent variable ...Get Instant Access to Expert-Tailored Solutions
See step-by-step solutions with expert insights and AI powered tools for academic success
Step: 2
Step: 3
Ace Your Homework with AI
Get the answers you need in no time with our AI-driven, step-by-step assistance
Get StartedRecommended Textbook for
Probability and Random Processes With Applications to Signal Processing and Communications
Authors: Scott Miller, Donald Childers
2nd edition
123869811, 978-0121726515, 121726517, 978-0130200716, 978-0123869814
Students also viewed these Mathematics questions
Question
Answered: 1 week ago
Question
Answered: 1 week ago
Question
Answered: 1 week ago
Question
Answered: 1 week ago
Question
Answered: 1 week ago
Question
Answered: 1 week ago
Question
Answered: 1 week ago
Question
Answered: 1 week ago
Question
Answered: 1 week ago
Question
Answered: 1 week ago
Question
Answered: 1 week ago
Question
Answered: 1 week ago
Question
Answered: 1 week ago
Question
Answered: 1 week ago
Question
Answered: 1 week ago
Question
Answered: 1 week ago
Question
Answered: 1 week ago
Question
Answered: 1 week ago
Question
Answered: 1 week ago
Question
Answered: 1 week ago
View Answer in SolutionInn App