Answered step by step
Verified Expert Solution
Question
1 Approved Answer
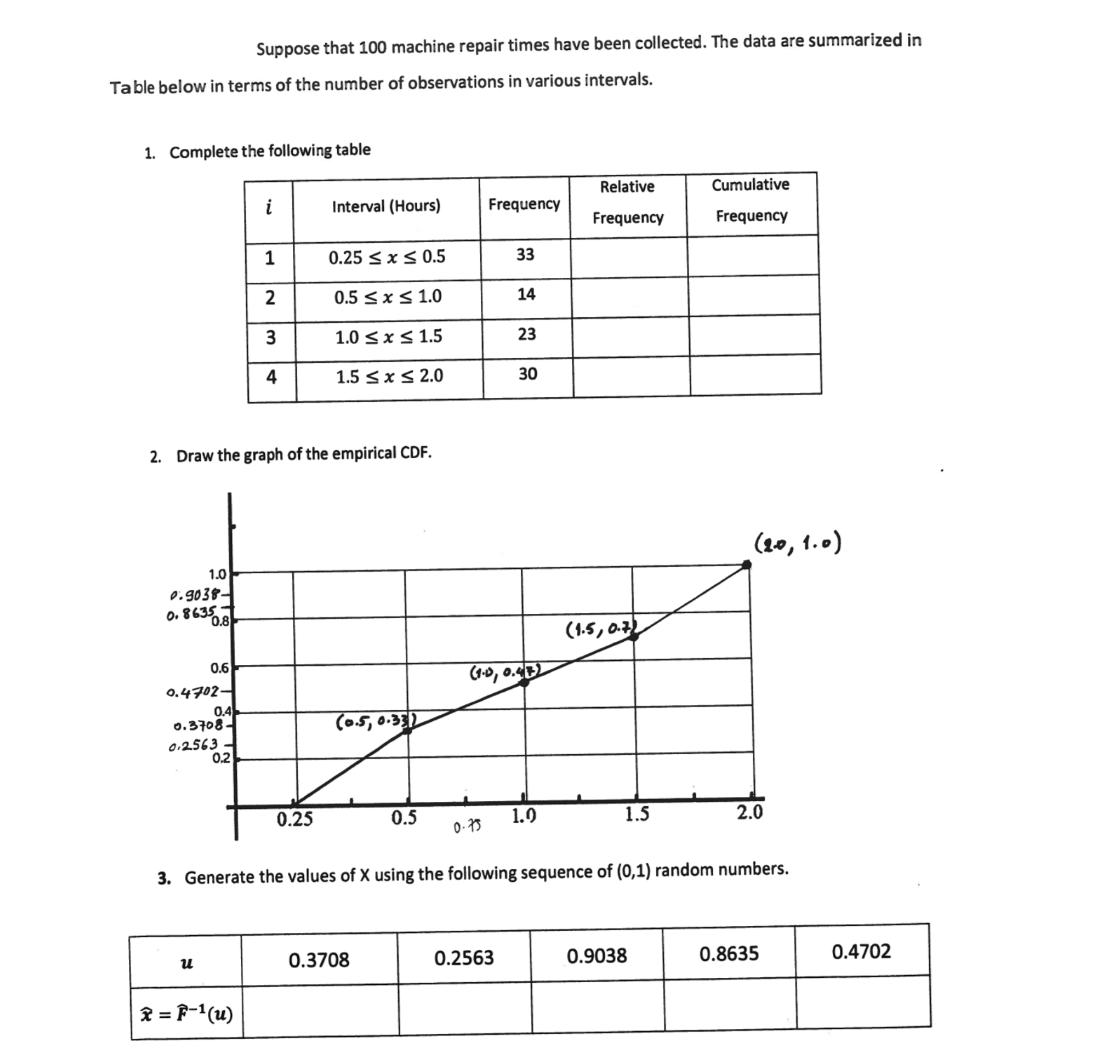
Suppose that 100 machine repair times have been collected. The data are summarized in Table below in terms of the number of observations in

Suppose that 100 machine repair times have been collected. The data are summarized in Table below in terms of the number of observations in various intervals. 1. Complete the following table 1.0 0.9038- 0.86350.8 0.6 0.4702- 0.4 0.3708- 0.2563- 0.2 u i 2. Draw the graph of the empirical CDF. 1 2 x = F-(u) 3 4 Interval (Hours) 0.25 0.25 x 0.5 0.5 x 1.0 1.0 x 1.5 1.5 x 2.0 (0.5, 0.331) 0.5 0.3708 Frequency 0.75 33 14 0.2563 23 (1-0, 0.412 30 1.0 Relative Frequency (1.5, 0.7) 1.5 3. Generate the values of X using the following sequence of (0,1) random numbers. Cumulative Frequency 0.9038 (20, 1.0) 2.0 0.8635 0.4702
Step by Step Solution
★★★★★
3.53 Rating (156 Votes )
There are 3 Steps involved in it
Step: 1
summarizing data and empirical cumulative distribution functions ECDF The data provided is the repair time for 100 machinesThe table shows the number of repairs that fall within certain time intervalsFor examplethere were 33 repairs that took between 025 and 05 hours The question asks you to complete the table by calculating the relative frequencywhich is the number of observations in a class divided by the total number of observations 100 in this caseYou can find this by dividing each frequency by 100The cumulative frequency is the sum of the relative frequencies up to that classSofor class 1the cumulative frequency would be 33100 The second part of the question asks you to graph the empirical CDFThe ECDF is a function that shows the probability that a variable will be less than or equal to a certain valueYou can graph the ECDF by plotting the cumulative frequency from the table on the yaxis and the upper bound of each interval on the xaxis The last part of the question asks you to generate values of X using a sequence of random numbers You can do this by using the inverse transform method This method involves finding the inverse of the ECDF denoted by F1u and evaluating it at a set of random numbers between 0 and 1 The inverse transform method works because if U is a random variable uniformly distributed on 0 1 then F1U will have the same distribution as X Indepth Explanation of Repair Time Data and Empirical CDF Lets delve deeper into the concepts involved in the repair time data and the empirical cumulative distribution function ECDF Data Breakdown We have data on the repair times of 100 machinescategorized into intervalsThe table shows the frequency number of repairs that fall within each interval For instancethere were 33 repairs that took between 025 and 05 hours inclusiveThis doesnt necessarily mean there were repairs that lasted exactly 025 or 05 hours it signifies the range of times captured in that interval Deriving Relative Frequency and Cumulative Frequency Relative Frequency This represents the proportion of repairs within a specific interval compared to the total number of repairs 100 in this case Its calculated by dividing the frequency of each interval by 100 ExampleRelative Frequency for class 1 02505 hours Frequency 33 Total Observations 100 033 Cumulative Frequency This indicates the total proportion of repairs that fall at or below a particular intervals ...
Get Instant Access to Expert-Tailored Solutions
See step-by-step solutions with expert insights and AI powered tools for academic success
Step: 2

Step: 3

Ace Your Homework with AI
Get the answers you need in no time with our AI-driven, step-by-step assistance
Get Started


